")
")

The Data Explorer allows you to examine all the data underlying the footprints.
Please note that only the landscape view is useful on smartphones.
Access the Data Explorer via:
Contact the development team
For questions, requests or suggestions for improvement, please send an email to
Use options
Press bzw. to hide/show the areas highlighted in light blue.
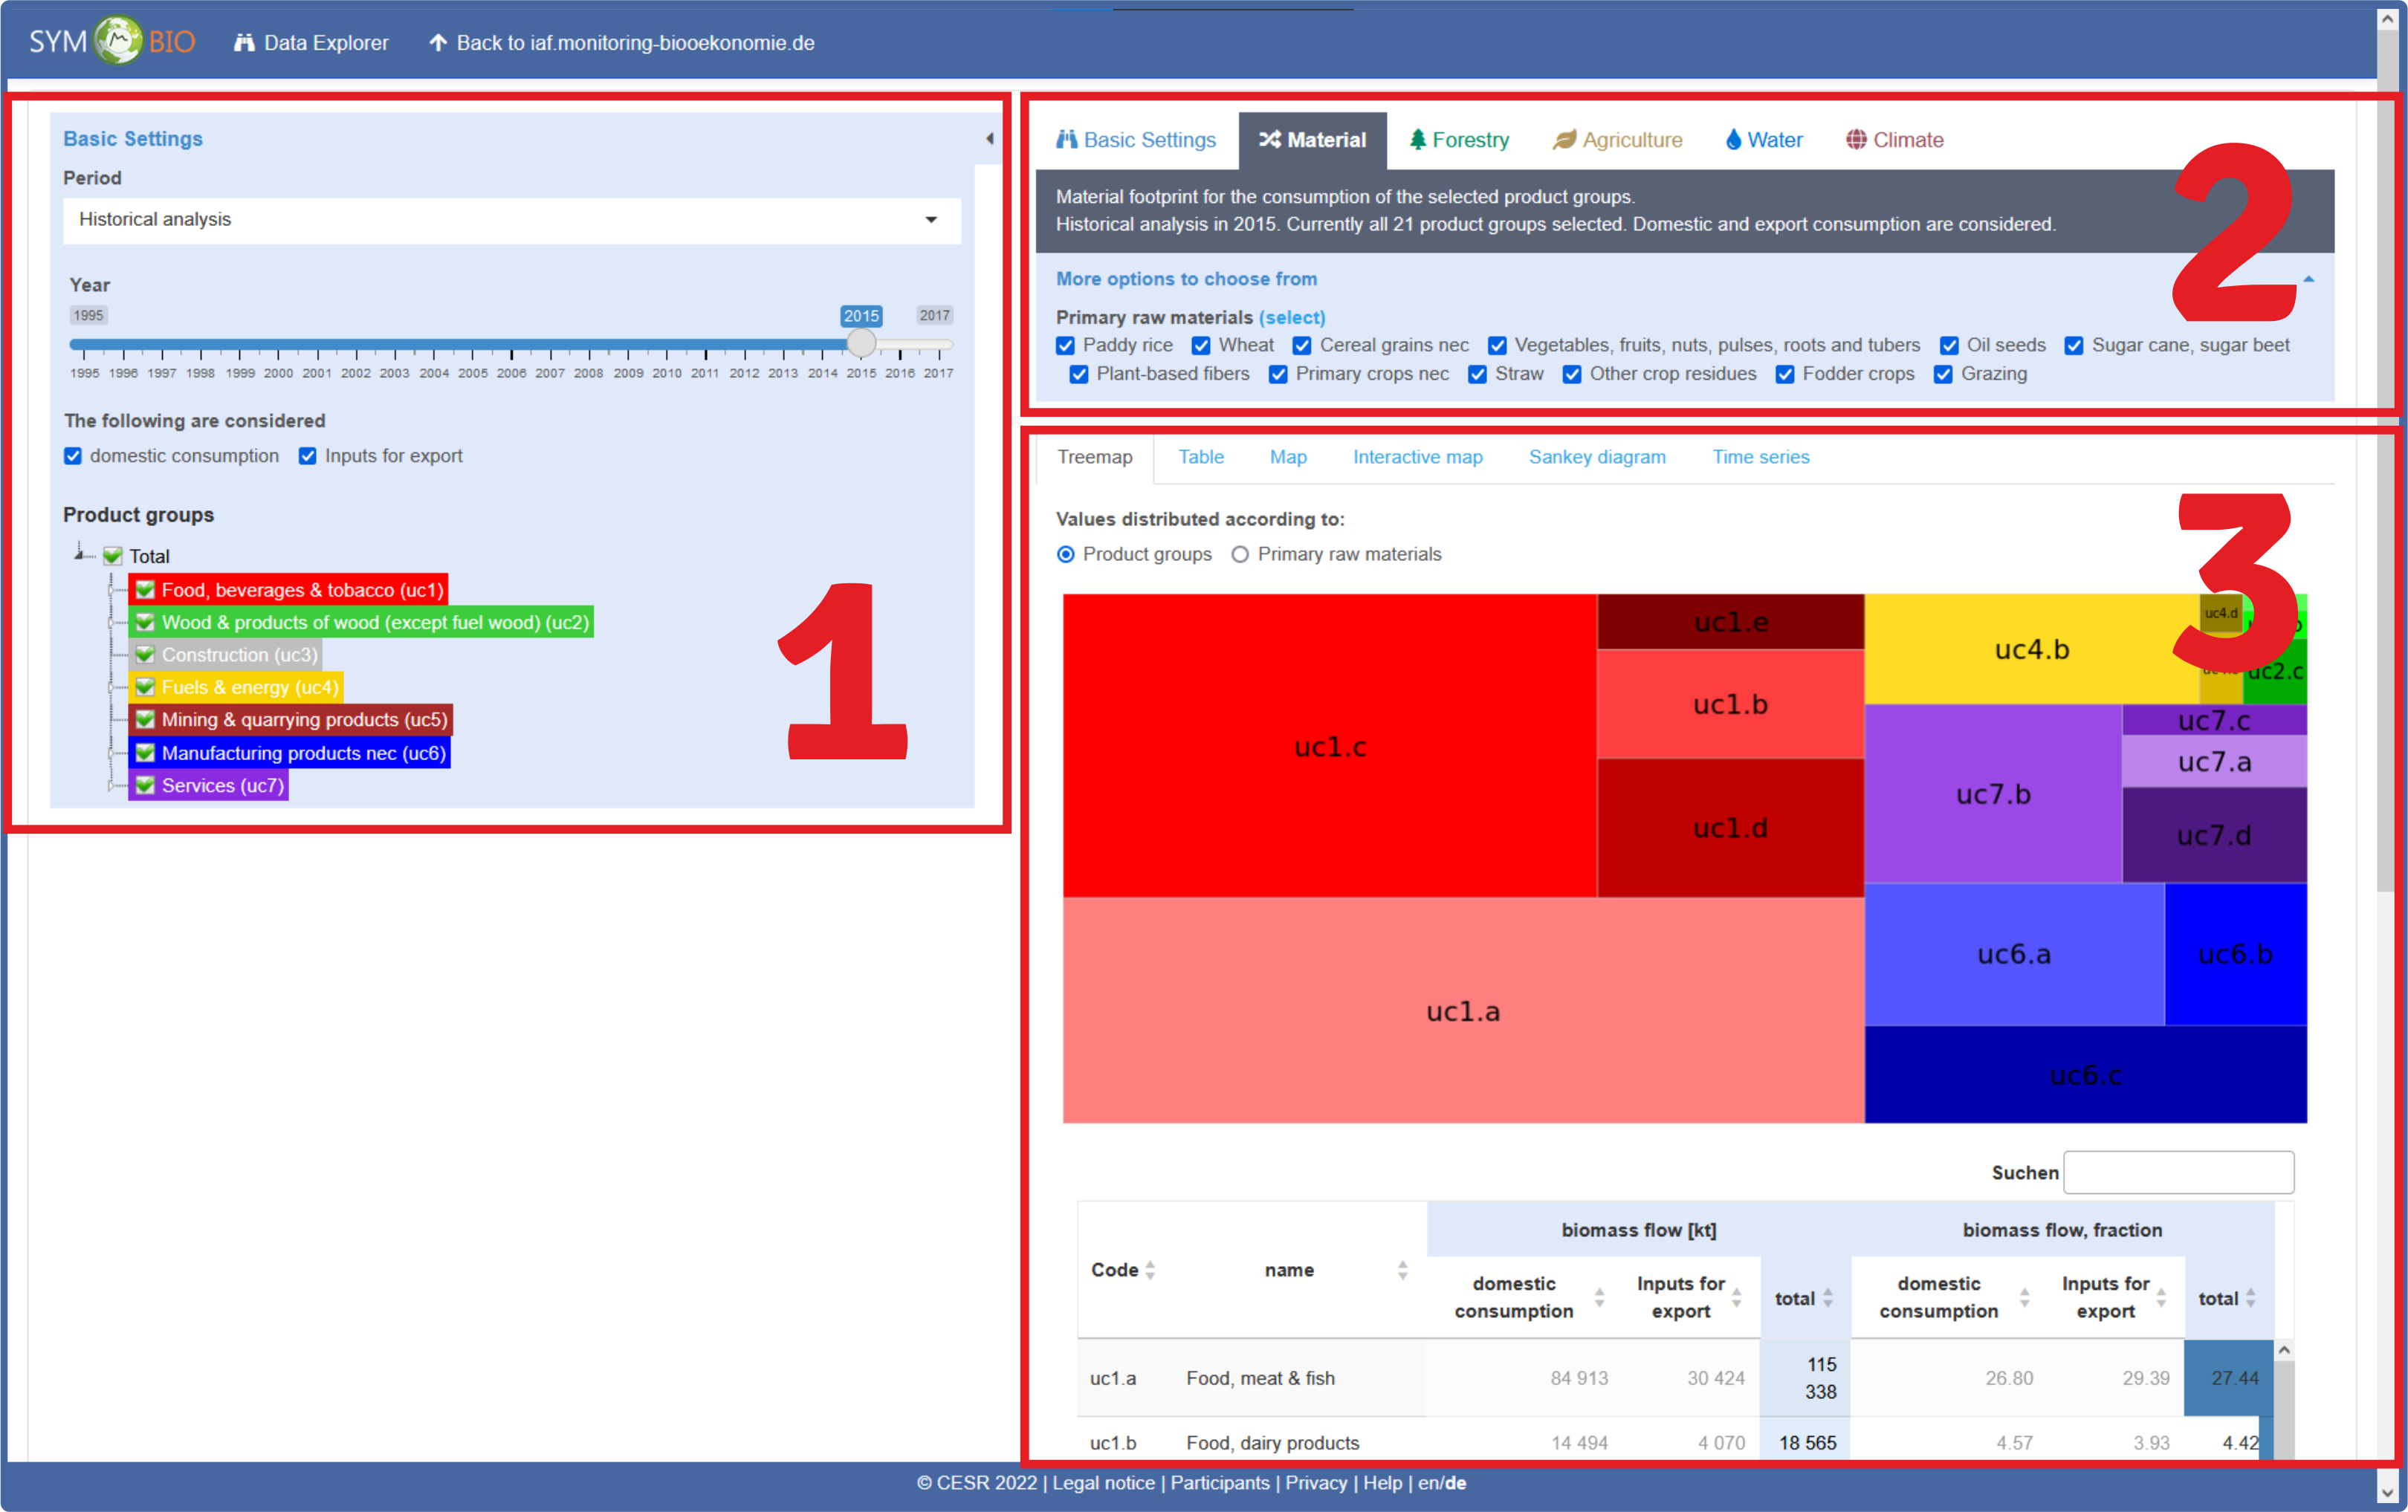
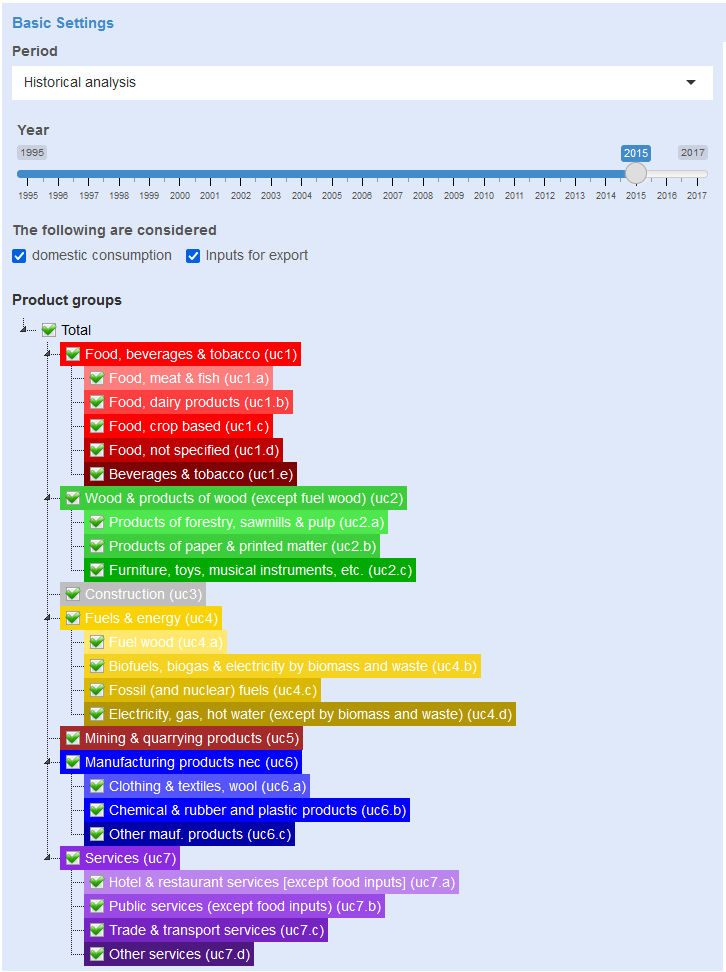
1. Basic settings for all footprints
For all footprints these settings applies (left column):
- The datenbase (historical data and various trend analyses).
- The time period, which is to be considered in the selected data basis.
- Whether only domestic consumption or also consumption caused by exports should be considered.
- You can choose from seven product groups, which contain further subgroups (click on the small white triangle pointing to the right to expand).
Each product group has a specific need for primary raw materials. - The colouring of the product groups is used in all charts that break down by product groups.
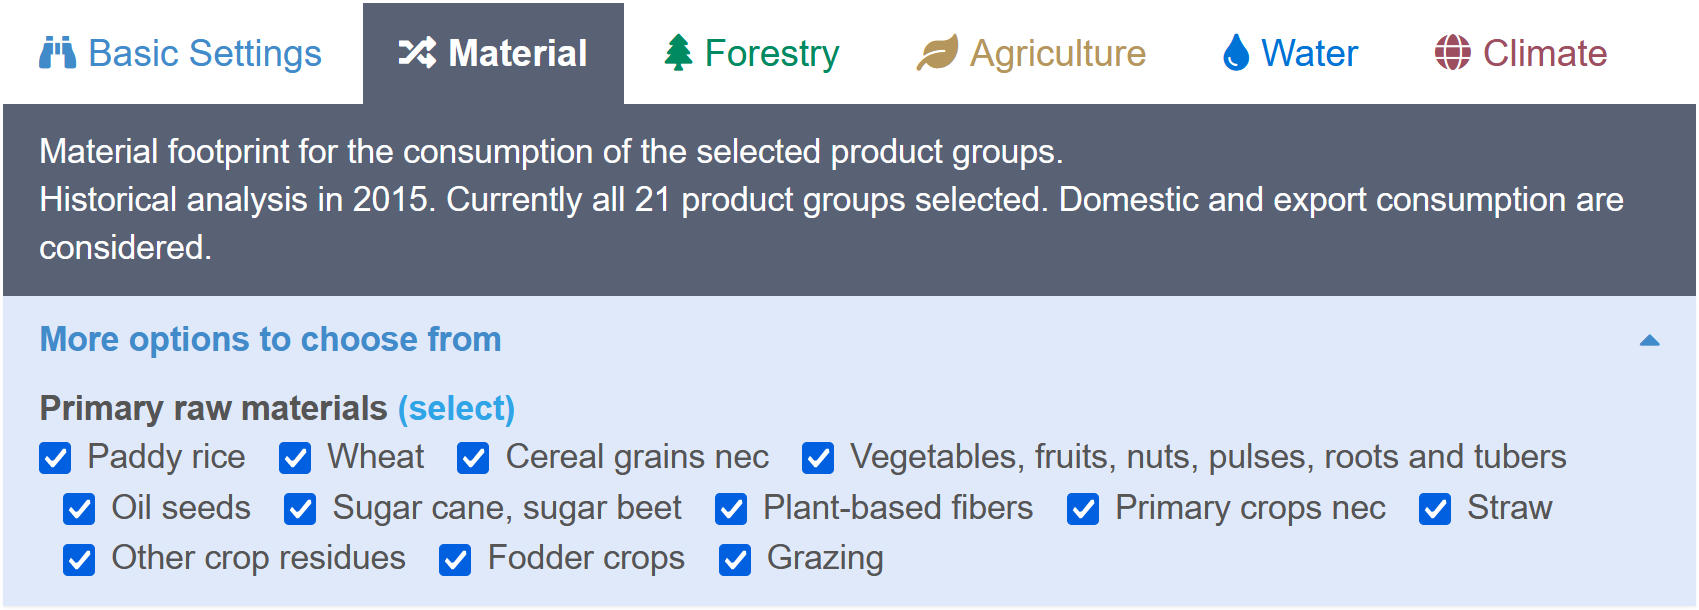
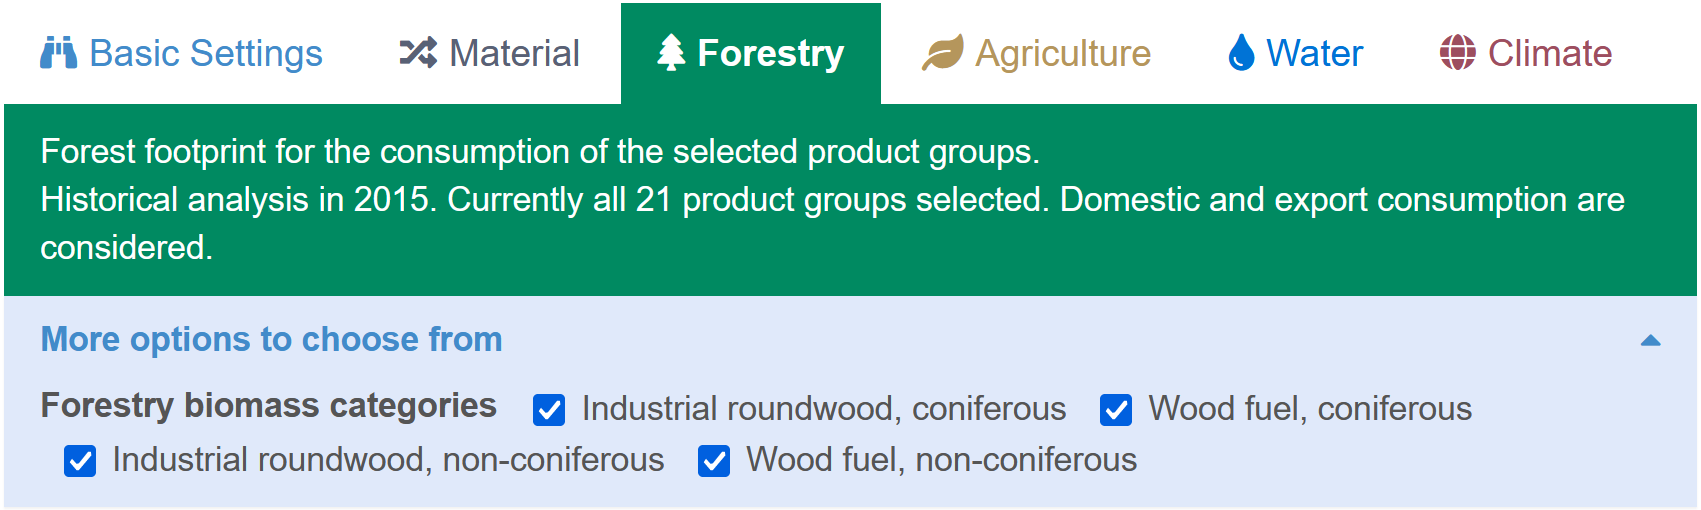
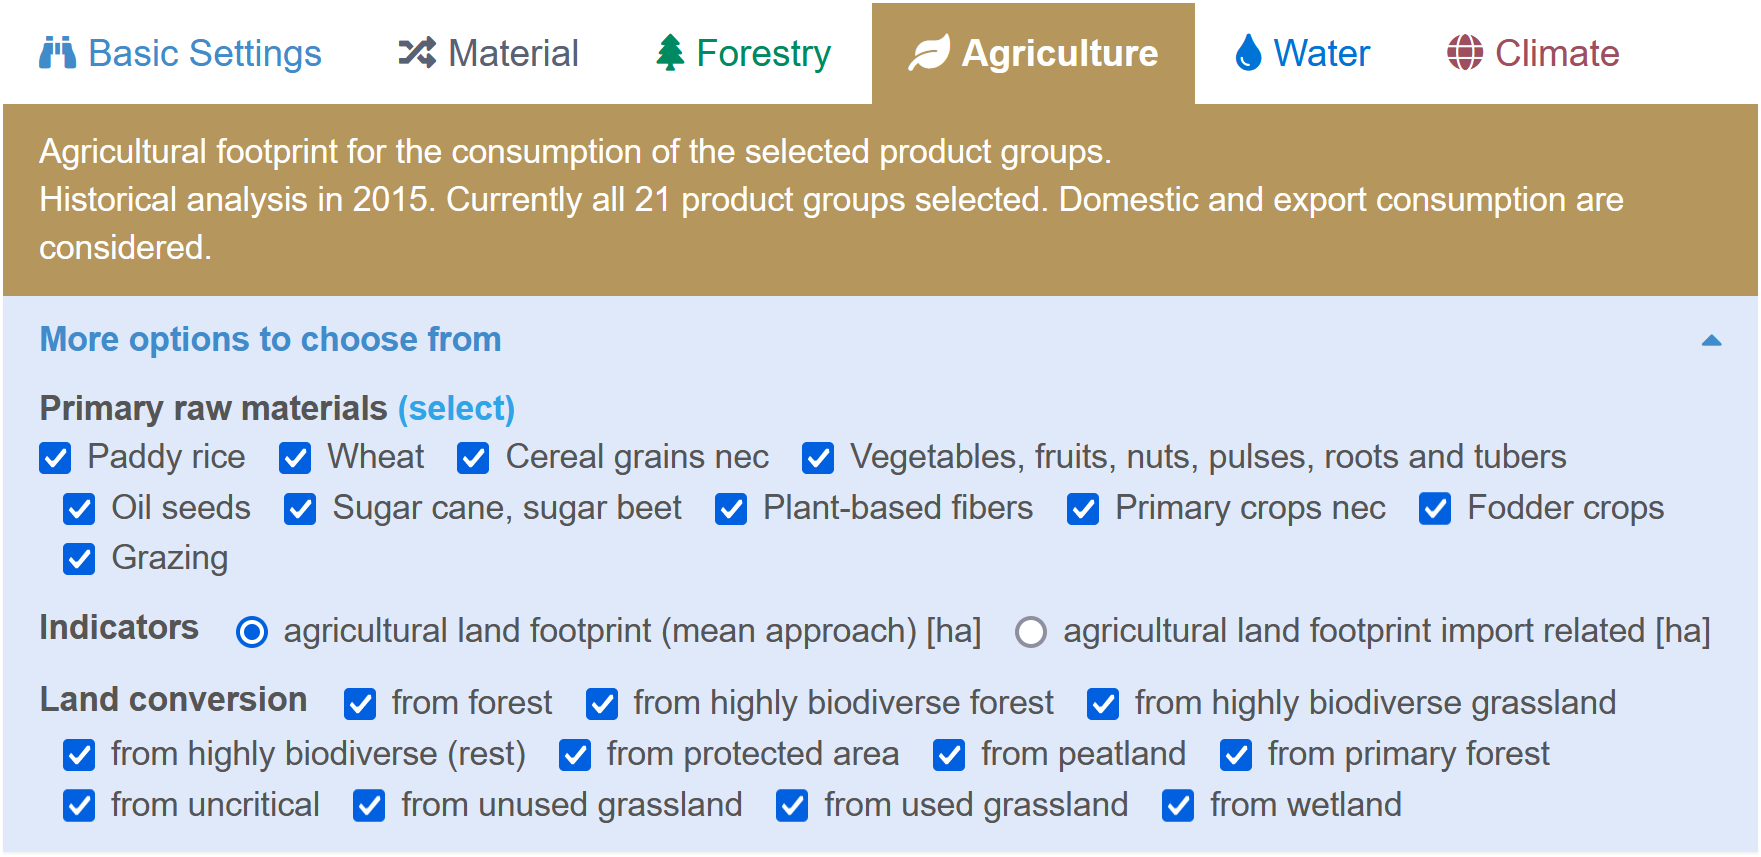
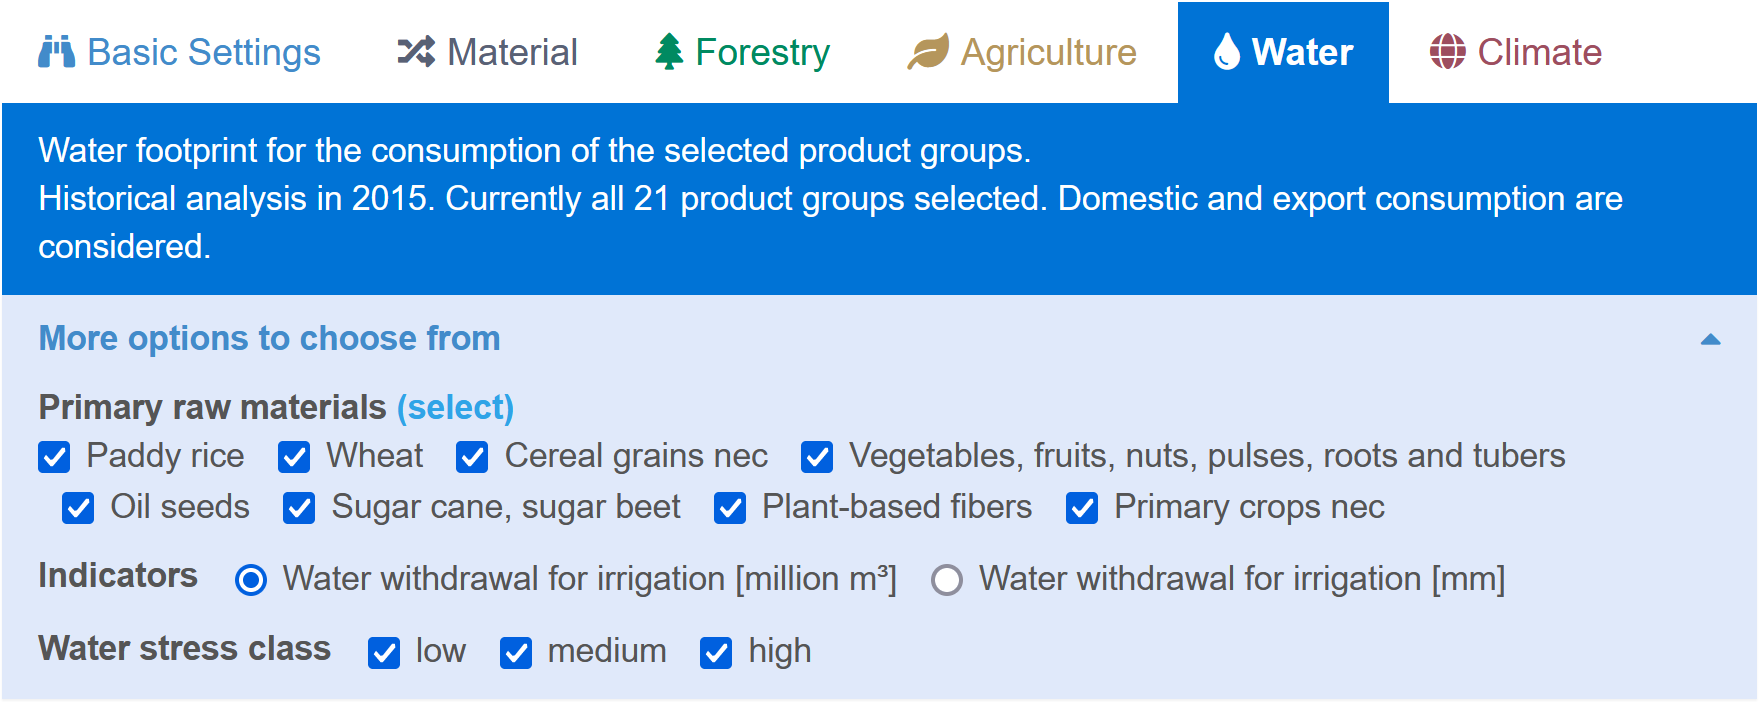
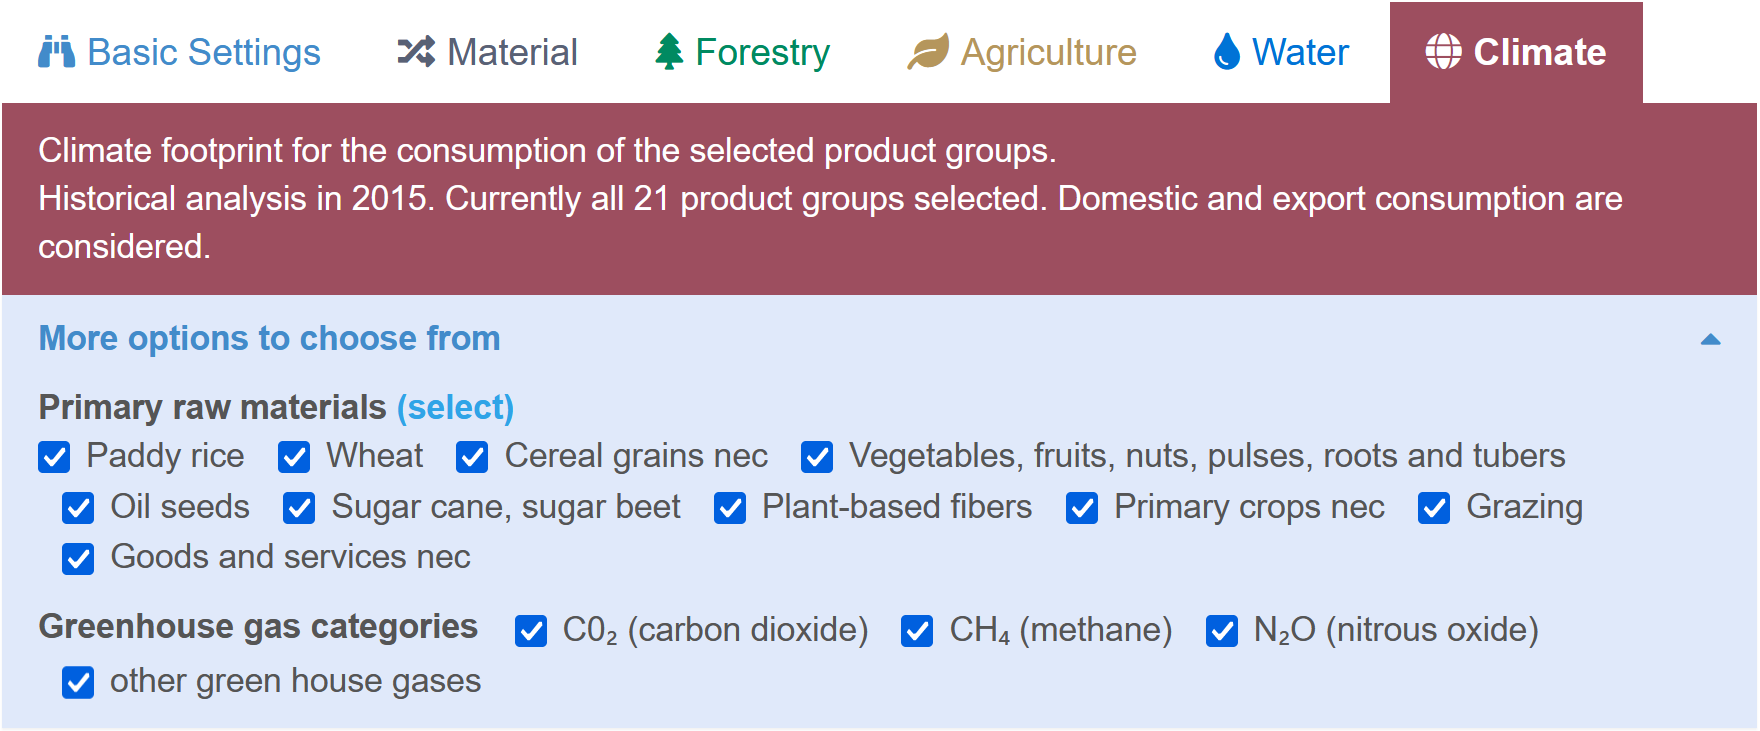
2. Footprint selection
For the footprint selected in the right column, the amount of data can be further limited and different visualisations can be selected:
- In the coloured area below the tab, the selection of the left column is summarised in text.
- Except for forestry, the primary raw materials taken into account in the footprint can always be selected.
- Depending on the footprint, further indicators can be selected.
3. Footprint visualisations
Below this, various visualisations of the previously selected data are available via tabs:
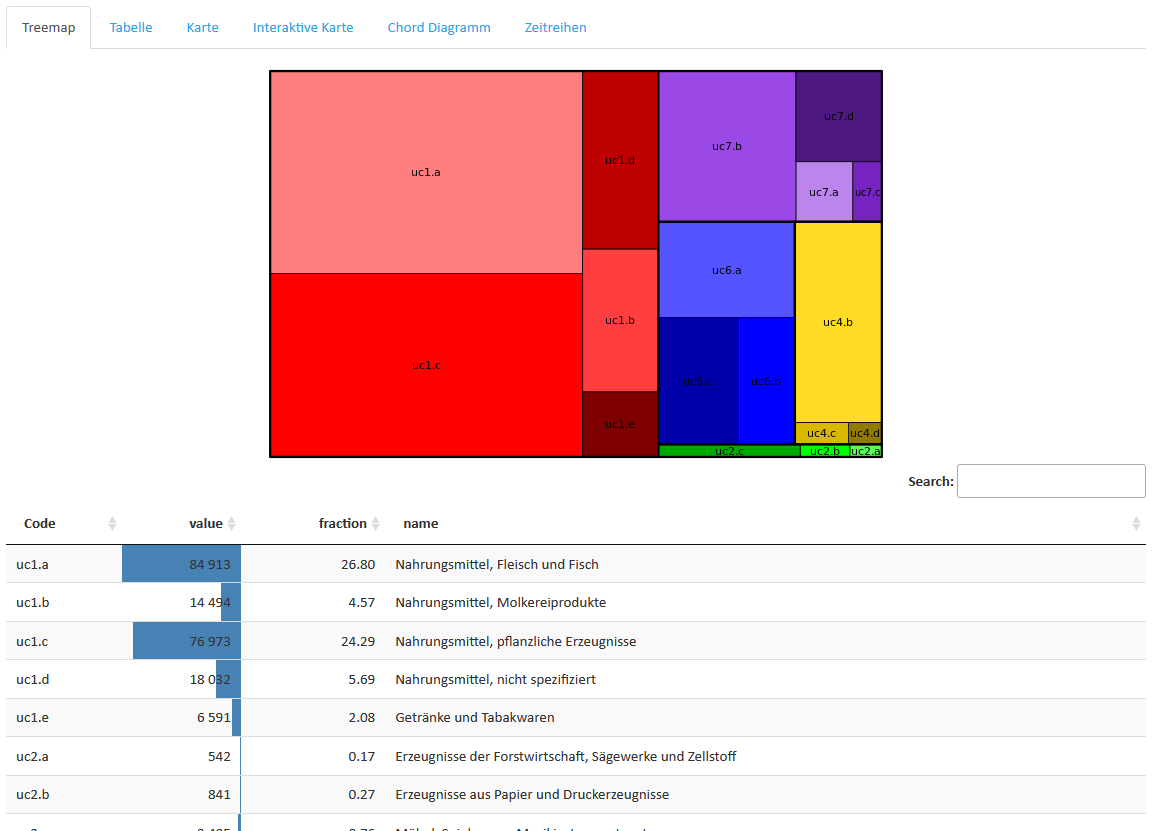
- Treemap: The treemap visualises the proportions of the selected primary raw materials, product groups and indicators.
- The codes of the product groups are further broken down in the table below and their shares are displayed.
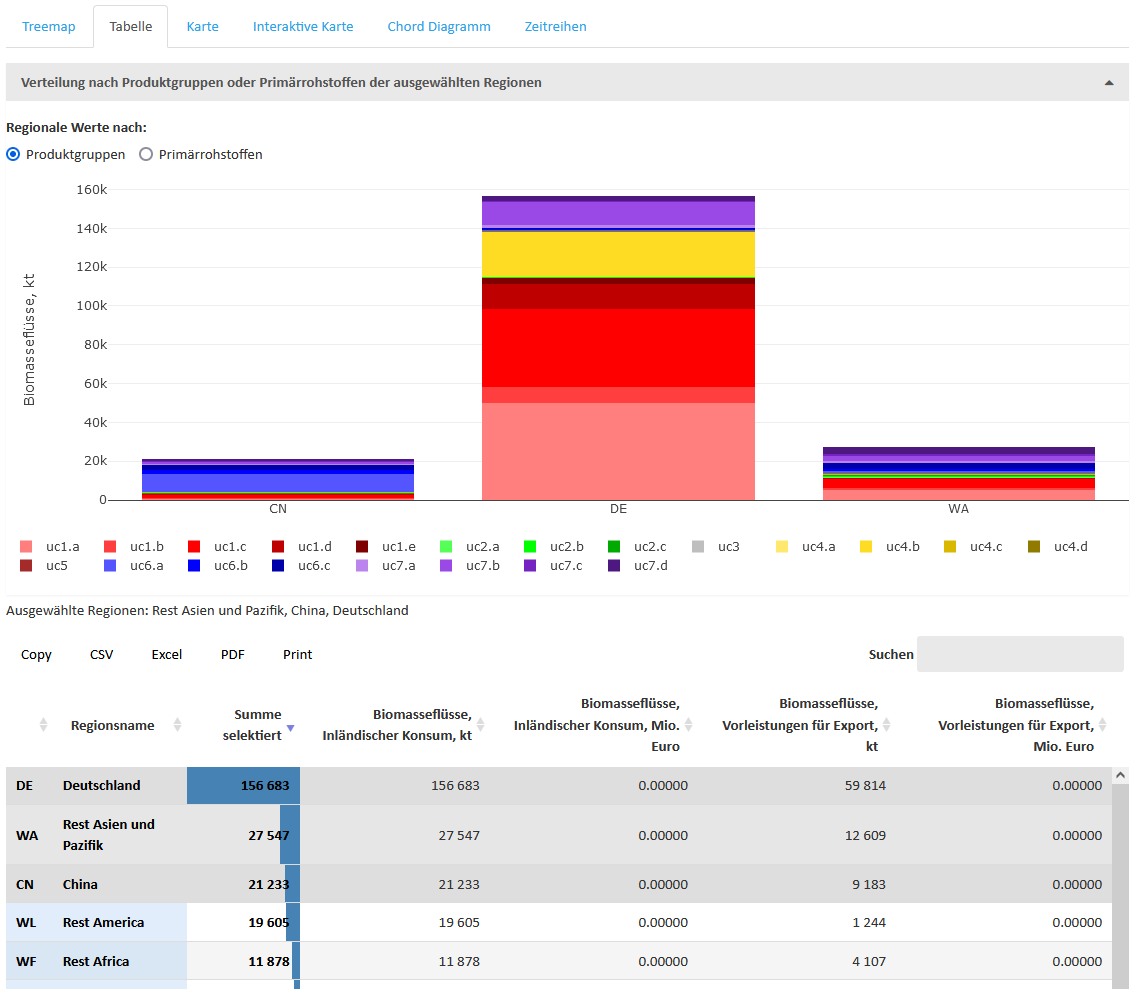
- Table: The selected data is displayed in tabular form for countries and regions.
- There, these data can also be downloaded in various formats
- Additional selection: If you click on countries and regions, they are highlighted in grey and above the table, the regional values by product groups or primary raw materials for the selection are displayed side by side in stacked bar charts. In the legend below the bar chart, the visibility of the product groups or primary raw materials displayed there can also be selected (click in the legend, deactivated feature is displayed dull).
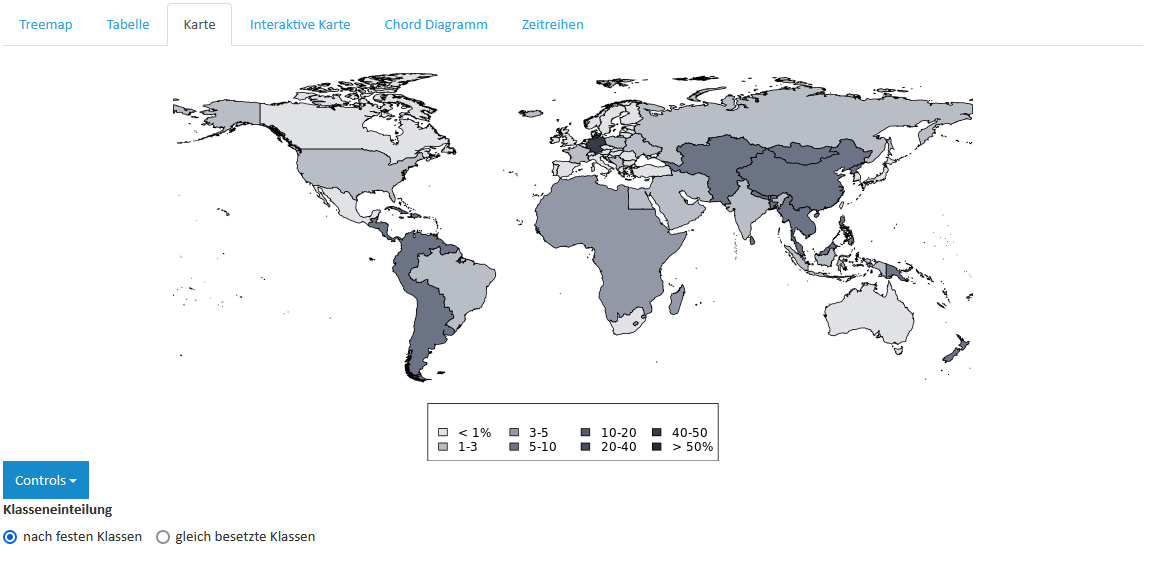
- Map: Shows the regional distribution (realtive) according to selectable class divisions.
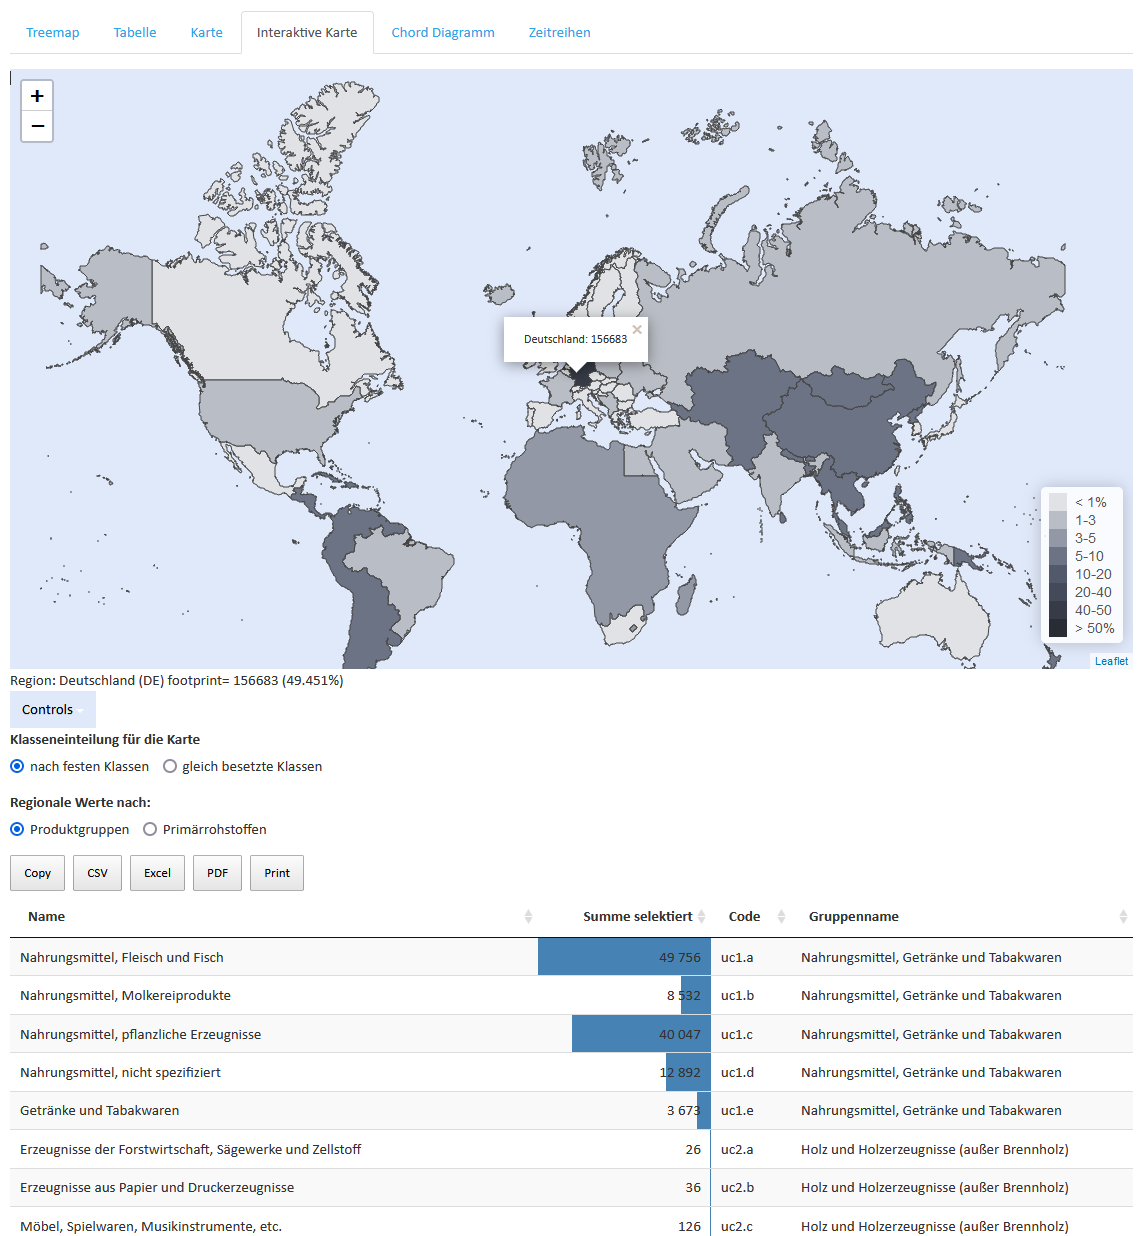
- Interactive map: As before, but zoomable and after clicking on a country or region, the data for the selection under the map are displayed in tabular form according to product groups or primary raw materials. This data can also be downloaded.
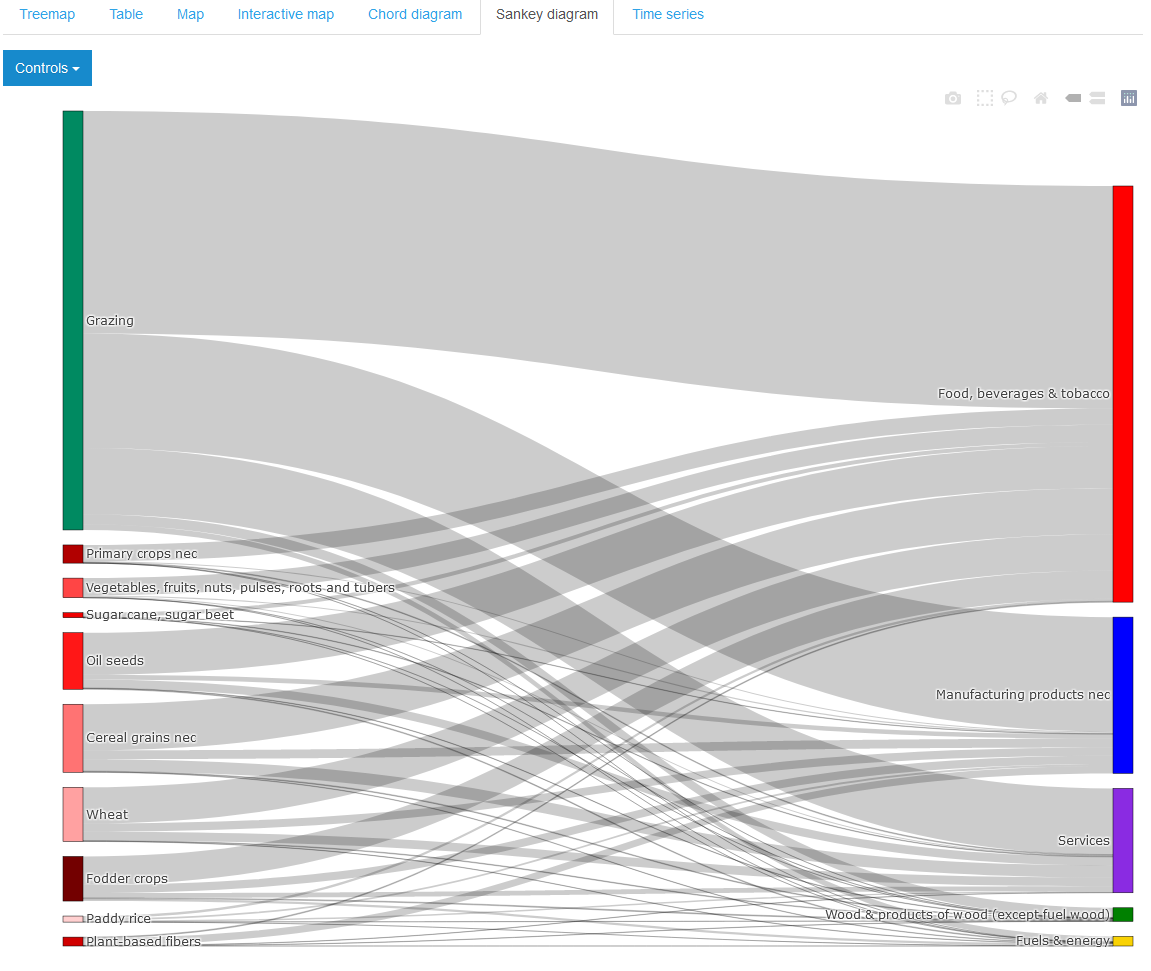
- The Sanky diagram graphically represents quantity flows proportional to the total quantity.
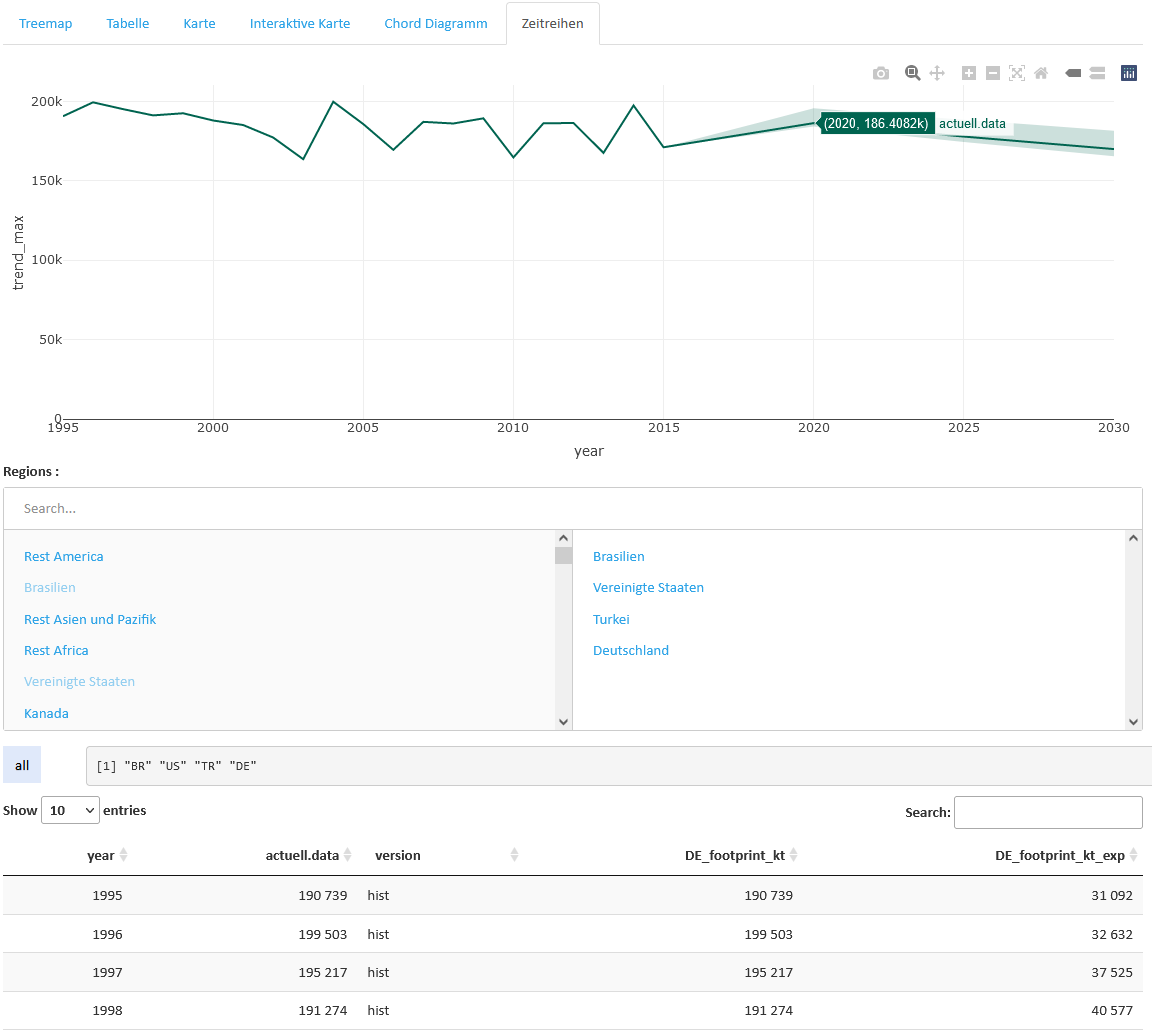
- Time series: Here the data for the selected countries and regions are shown over time and, from the reference year onwards, also the range of the trend analyses (light green area).
In the diagram, a range of the time course can be selected with the mouse and navigated in it. The displayed diagram can be downloaded as an image.
<