")
")
What is Input-Output analysis? I How does MRIO analysis contribute to assessing the bioeconomy? I Limitations
What is Input-Output analysis?
One way to quantify and assess the socioeconomic metabolism within the MFA framework is to use Input-Output (IO) analysis. Input-Output analysis began as a technique to structure and trace trade flows between industrial sectors of an economy. This modeling technique was first proposed in 1936 [1]. In the 70s, it was accepted as a method to support physical flow accounting [2]. In simple terms, Input-Output models structure trade data in specific table formats and by applying an algorithm to these tables, trade flows associated with the consumption of a final good in a certain country or region can be deduced and traced; all the way back to the points of production along value chains.
A Multi-Regional Input-Output (MRIO) model implies that the input-output table covers intersectoral trade within and between regions and countries. This is used for national monitoring to capture global supply chains. In recent decades, MRIO has turned into an established method to trace global trade flows and calculate national consumption footprints [3].
To link environmental pressures and impacts to the MRIO model, additional tables, so-called environmental extensions, comprise resource inputs or emissions related to the production and use of a certain crop (or product group) in a specific country or region. The environmental extensions form the basis for national footprint accounting and generally include data on biomass quantities, land and water use, and GHG emissions. MRIO models differ in their coverage of sectors, countries, and environmental extensions [4].
There are several global MRIO models available: GLORIA [5] was developed for and is used by the UN International Resource Panel (IRP), and the OECD provides the OECD Inter-Country Input-Output tables. Physical MRIO tables have been developed to decrease the uncertainty related to the translation between monetary and physical flows. For instance, the “Food and Agriculture Biomass Input-Output model” [8] provides trade data in physical units and the broadly used MRIO database EXIOBASE is available also as a hybrid between monetary and physical flows.
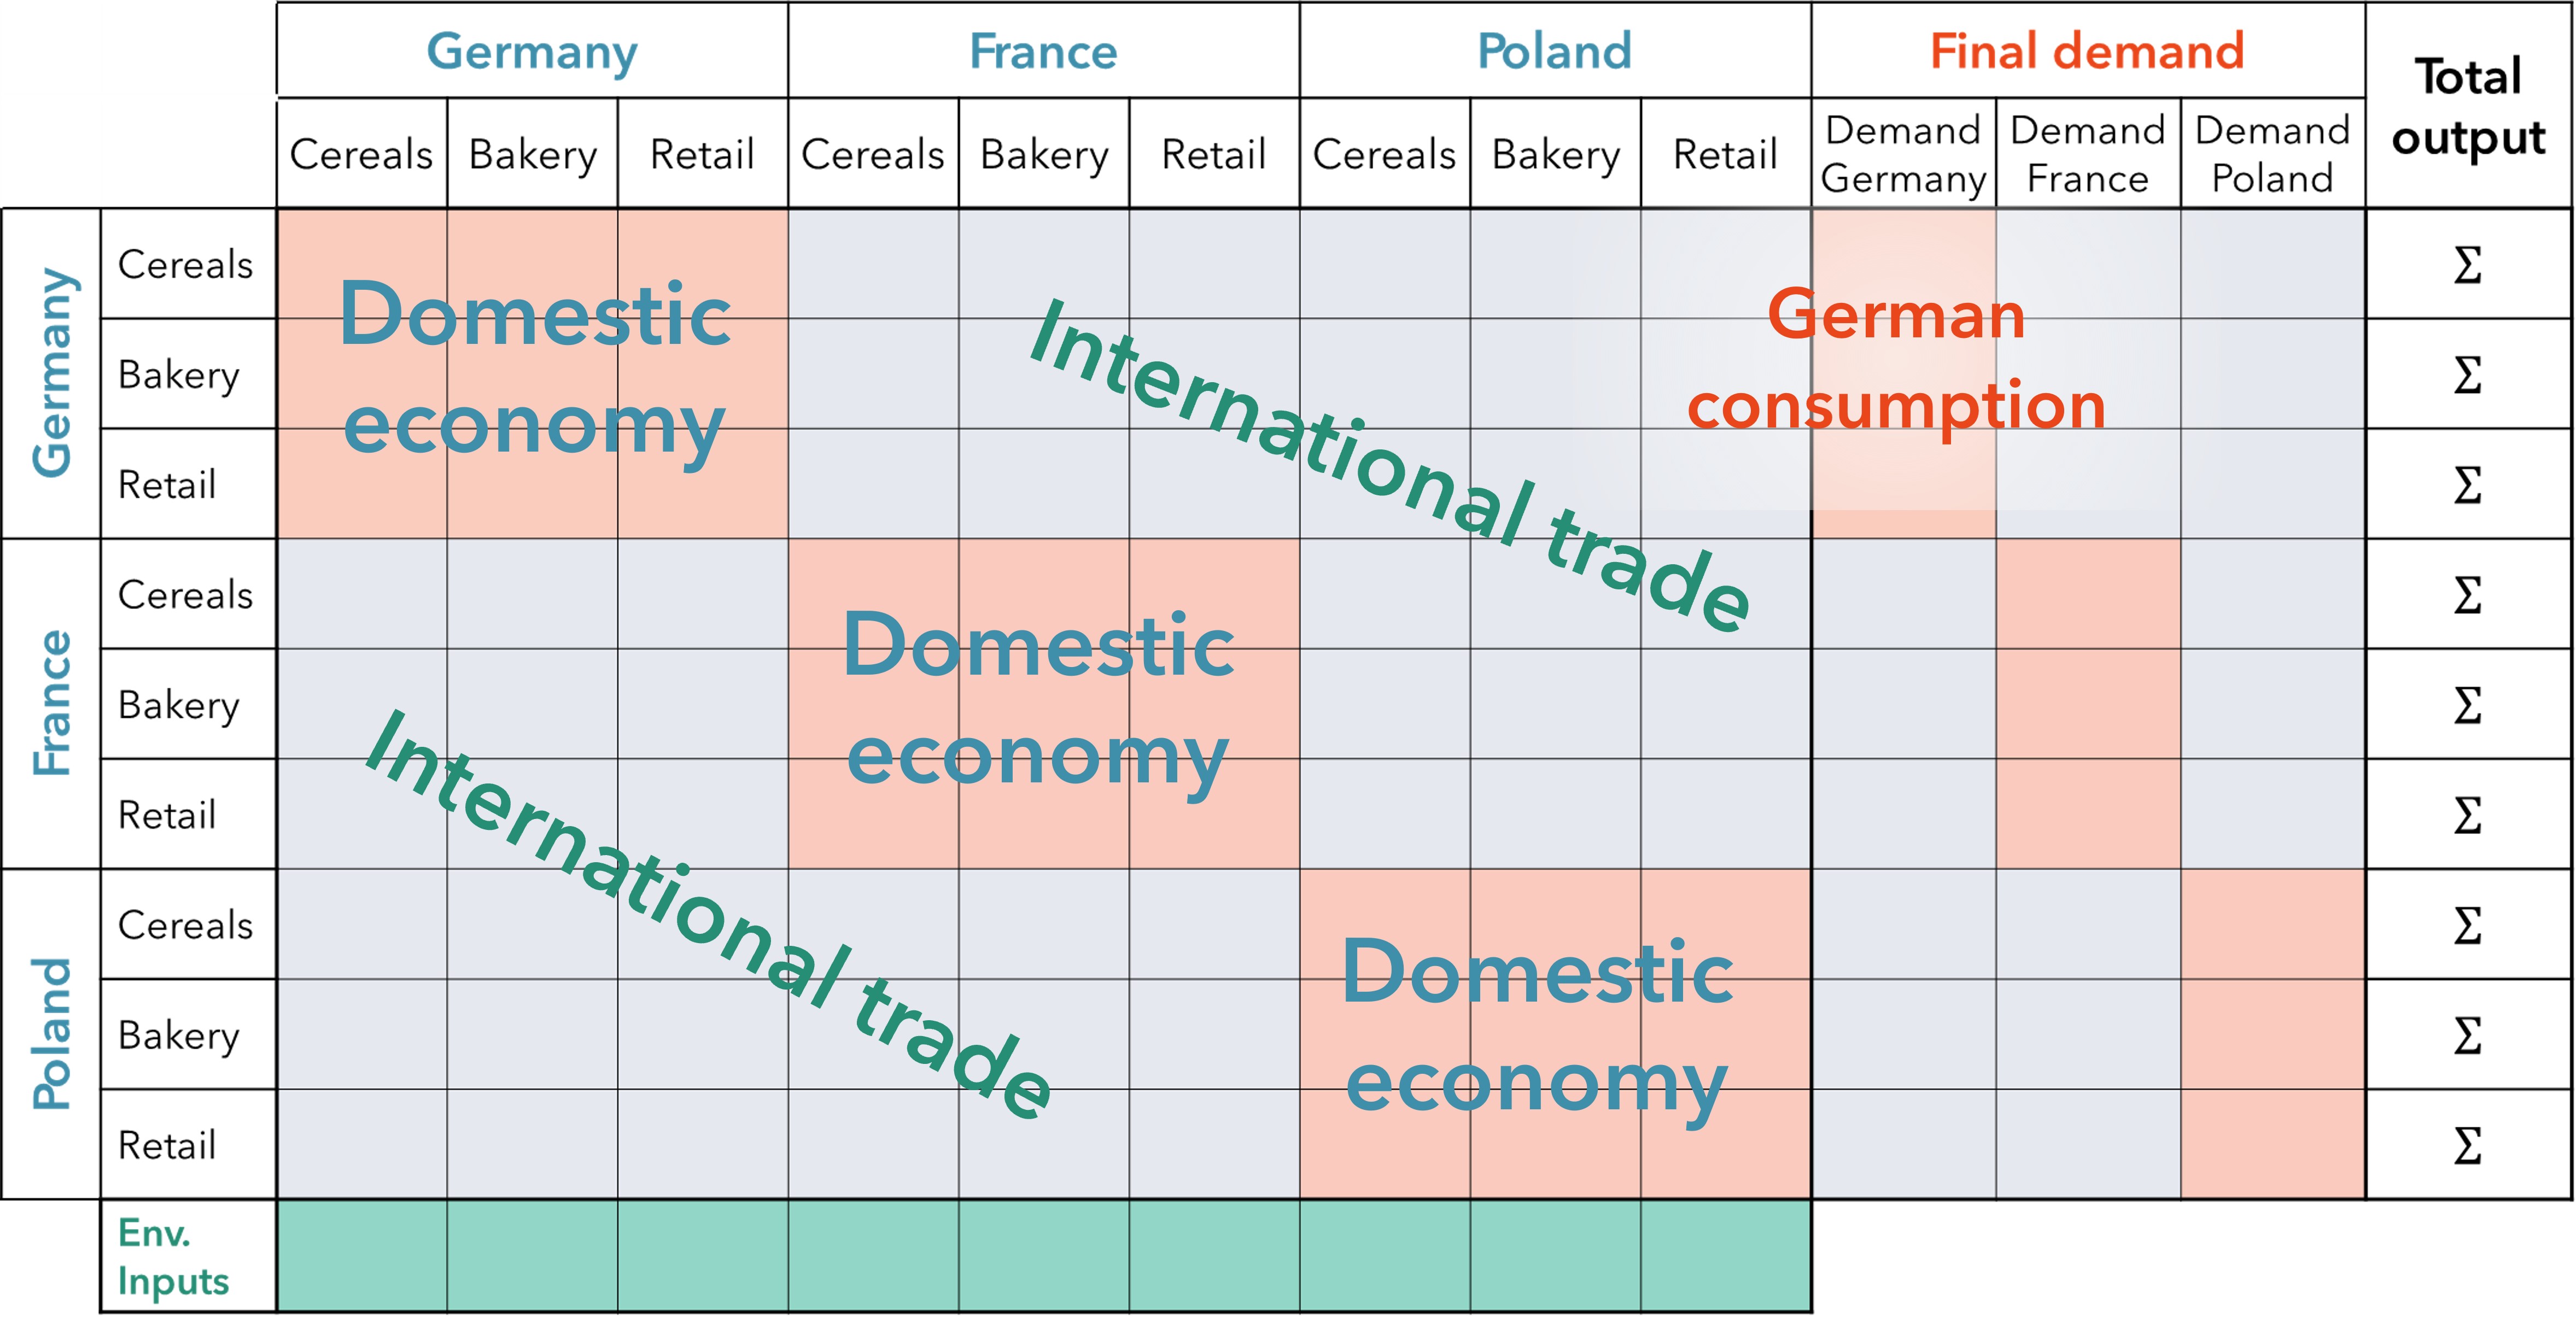
MRIO models are made up of tables of trade data. Mathematical algorithms help trace the trade flows through the data tables, from final consumption to the point of production (Source: based on Martin Bruckner [10]).
How does MRIO analysis contribute to assessing the bioeconomy?
With the expansion of global trade and increasing environmental degradation, tracing global supply chains and their environmental pressures has become indispensable. Therefore, MRIO makes up the core of national consumption footprint calculations. Linking consumption to production and the associated resource use is key to understanding system interactions and linking socioeconomic drivers with environmental pressures and impacts [11], irrespective of domestic or foreign production. For a balanced bioeconomy, this understanding is crucial.
MRIO has provided this kind of information ever since the 80s. Initially, the analyses focused on materials, energy flows and landuse accounting [2]. Today, it is used for diverse footprint analyses [12]. The key property of MRIO is to quantify the relations between the final consumption of goods, their intermediates in production, trade and primary production in agriculture, forestry, fisheries and mining. Thus, MRIO has become an important tool to determine the environmental and socio-economic footprints of economies. These can be used to unveil the relationship between e.g. the material footprint and SDG 12, responsible consumption and production. The material footprint perspective can also uncover key aspects related to SDG 8.4, resource efficiency [13]. Global land footprints provide crucial information for policymaking aiming for a more sustainable bioeconomy [14]. By modeling scenarios of changed consumption patterns, alternatives and their environmental benefits can be illustrated [15].
Limitations
As with all methods, MRIO faces some challenges and limitations. MRIO-based footprints show how economic relations induce and relocate resource extraction or GHG emissions. However, to also trace the actual physical flows across global trade networks, scholars have recently developed MRIO tables in physical terms. Yet, sectoral and inter-regional trade is better documented in monetary terms making economy-wide physical MRIO a challenge [16]. A main conceptual limitation is the dichotomy between the linearity of footprint assessments and the non-linear dynamics of ecological systems [17]. The resource extraction affects ecological- and earth systems that are characterized by thresholds and abrupt change, fast and slow processes, delays, surprises, and feedback loops which need to be covered by other models [18]. Thus, research on impacts, ecosystem dynamics and thresholds is crucial to understand the implications of the footprints. A disadvantage of the method is the very time-consuming compilation of data. Because of this, MRIO-tables are only available with some time delay. In addition, the highly aggregated sectors [9] provide only limited insight into the sectoral division of resources. This can be developed by pivot tables [6] or in combination with life-cycle assessments (LCA) or hybrid LCA [7].
Despite these challenges, MRIO makes up a powerful tool to trace the induction of material flows through different sectors and economies, making it particularly suitable for footprint assessments in a globalized economy.
Notes and references
- It was first proposed by Wassily Leontief, who has also given name to a key part of the algorithm, the “Leontief inverse”. The foundations and extensions of Input-Output Analysis are thoroughly described in the broadly used book by Miller and Blair (2009). Input-Output Analysis: Foundations and Extensions. doi: 10.1017/CBO9780511626982.
- The foundations and extensions of Input-Output Analysis are thoroughly described in the broadly used book by Miller and Blair (2009). Input-Output Analysis: Foundations and Extensions. doi: 10.1017/CBO9780511626982.
- Galli et al. (2013). A Footprint Family extended MRIO model to support Europe's transition to a One Planet Economy. doi: 10.1016/j.scitotenv.2012.11.071.
- An overview assessment of the MRIO as a methodology, its advantages and disadvantages and possible future developments are provided by Wiedmann et al. (2011). Quo Vadis MRIO? Methodological, data and institutional requirements for multi-region input–output analysis. Econ. doi: 10.1016/j.ecolecon.2011.06.014.
- The database GLORIA is used by and has been developed for the UN International Resource Panel (UN IRP,) in the context of the update of the material footprint accounts forming part of the UN IRP Material Flows Database. It is built by the University of Sydney in collaboration with several research groups. It was first launched in 2017 and the latest release was in 2022. Available at: https://ielab.info/analyse/gloria
- A pivot table is a tool for summarizing and analyzing large data sets by sorting and aggregating the data into a purposeful format.
- See for instance: Jakobs et al. (2023). Where is my footprint located? Estimating the geographical variance of Hybrid-LCA footprints. doi: 10.21203/rs.3.rs-1442198/v3.
- Short: FABIO. See publication: Bruckner et al. (2019). FABIO-The Construction of the Food and Agriculture Biomass Input-Output Model. scien. & technol. doi: 10.1021/acs.est.9b03554, or the open access Database available at: https://zenodo.org/record/2577067#.Y7fvSRWZPEZ.
- Economy-wide MRIO tables include about 45 to 200 global sectors that capture all economic activities. Thus, sectors can include e.g. “raising of cattle”, “aluminum ore”, “machinery and equipment”, “road transport”, “material recovery”, and “education”. The examples from GLORIA are available at: https://ielab.info/analyse/gloria.
- Picture is based on teaching material from Martin Bruckner (WU). Institute of Ecological Economics, Vienna University of Economics and Buisness.
- The driver, pressures and impacts are parts of the DPSIR (Drivers, Pressures, States, Impacts, Responses) framework for structuring environmental indicators suggested by the European Environmental Agency (EEA) and broadly used in environmental systems research, monitoring, and societal learning processes.
- For instance, in SYMOBIO and MOBI II
- Egenolf and Bringezu (2019). Conceptualization of an Indicator System for Assessing the Sustainability of the Bioeconomy. Sustain. doi: 10.3390/su11020443.
- Lenzen et al. (2022). Implementing the material footprint to measure progress towards Sustainable Development Goals 8 and 12. Sustain. doi: 10.1038/s41893-021-00811-6.
Bruckner et al. (2019). Quantifying the global cropland footprint of the European Union’s non-food bioeconomy. Environ. Res. Lett. doi: 10.1088/1748-9326/ab07f5. - See for instance a study on alternative different dietary patterns and food waste reduction: Helander et al. (2021). Eating healthy or wasting less? Reducing resource footprints of food consumption. Res. Lett. doi: 10.1088/1748-9326/abe673.
- The access to trade data in physical units is limited. Therefore, there are yet no economy-wide database with exclusively physical data. See for more background information Bruckner et al. (2019). FABIO-The Construction of the Food and Agriculture Biomass Input-Output Model. scien. & technol. doi: 10.1021/acs.est.9b03554.
- In research, there is always a balance between informative and helpful (simplified) system models and the extent of complexity captured in the models. The latter is more holistic but complicates the interpretation of results.
- Vanham et al. (2019). Environmental footprint family to address local to planetary sustainability and deliver on the SDGs. The Scien. of the total environ. doi: 10.1016/j.scitotenv.2019.133642.