")
")

Agricultural area I Agriculture I Imports and footprints
Where and how is agricultural biomass sourced in Germany’s bioeconomy? This section looks at how land is used within Germany for agriculture, including challenges and potentials that may impact the bioeconomy transition in the future. It explores whether, how, and how much Germany uses agricultural land abroad to build its bioeconomy.
Agricultural area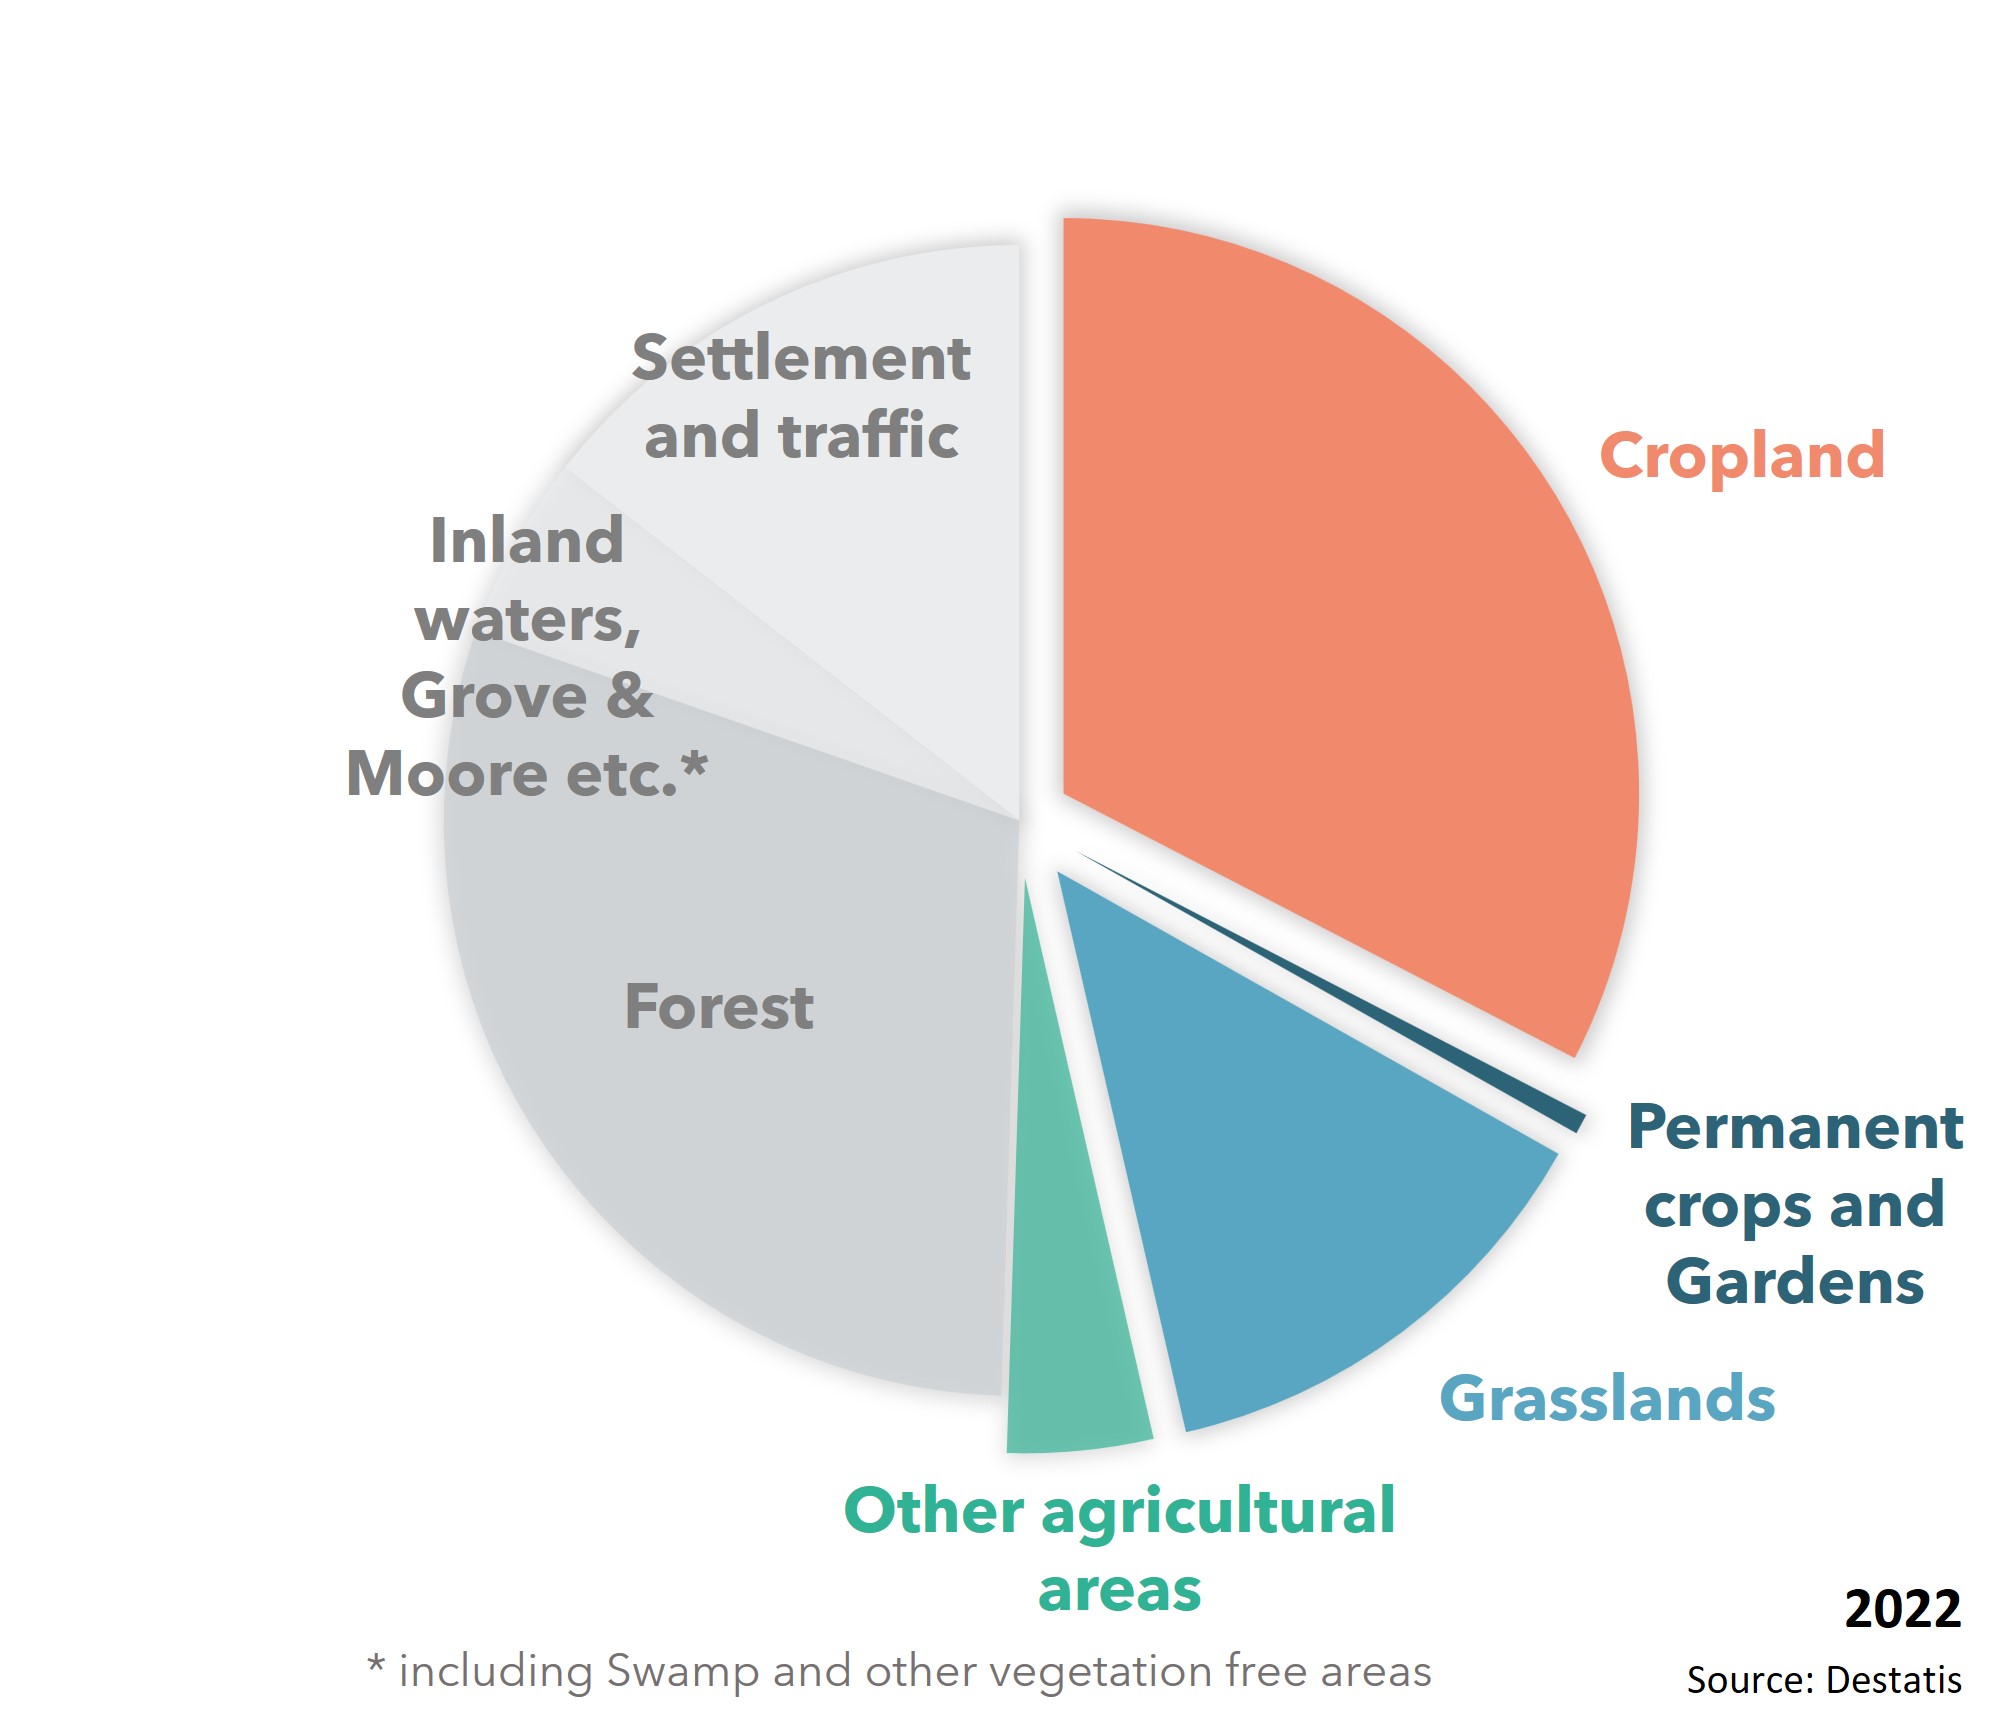
Agricultural land use out of total land in Germany, 2022. (Source: Destatis [4])
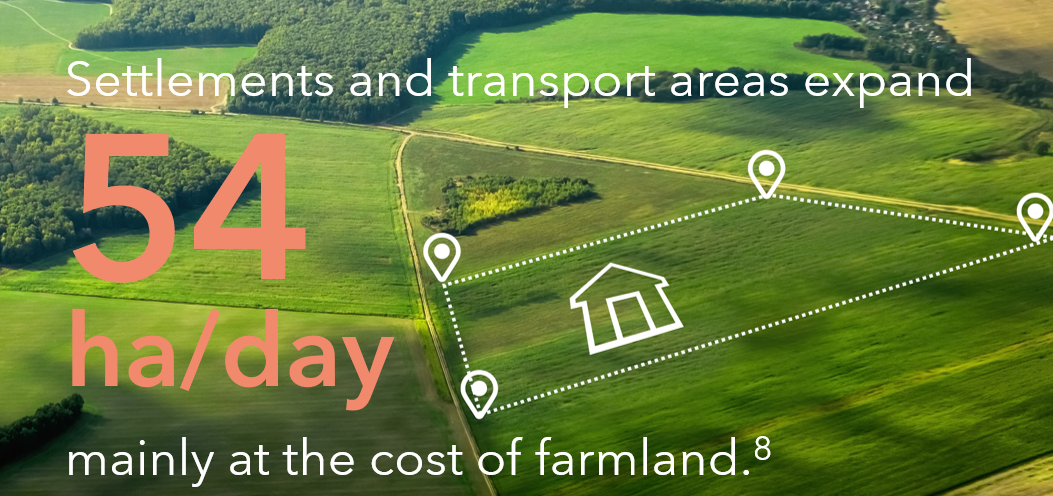
Half of Germany’s total land area is used for agriculture (or 18 Mha), including the farms [8]. The majority of farmland [9] is used for growing crops (70% is cropland), which is the most intensive use of farmlands. 29 % is grassland, which not only provides biomass but also habitats for many plants and animals, and 1% is permanent crops and gardens [8]. The area available for farming is decreasing. This is mainly due to the expansion of settlements and infrastructure, which on average was 54 hectares per day between 2017 and 2020 [12]. In contrast, the German national goal is a maximum of 30 hectares per day of land conversion (until 2030) [24]. The German Environment Agency recommends 20 hectares per day to 2030 [44], demonstrating that current trends are far from targets.
© Background image: olmax1975 | Adobe Stock
Agriculture
What is growing on the farmlands in Germany?
The most intensively used farmland is cropland. More than half of the cropland is used for cereals, and most prominently for wheat. Almost one fourth (24%) is used for plants for green harvest (mainly for fodder and partly for energetic use). These areas are dominated by silo maize and green maize. The remaining fourth is dominated by rapeseed and other commercial crops (11% of total cropland). Together, potatoes, sugar beets and other roots and pulses make up 8% of the total land use [1].
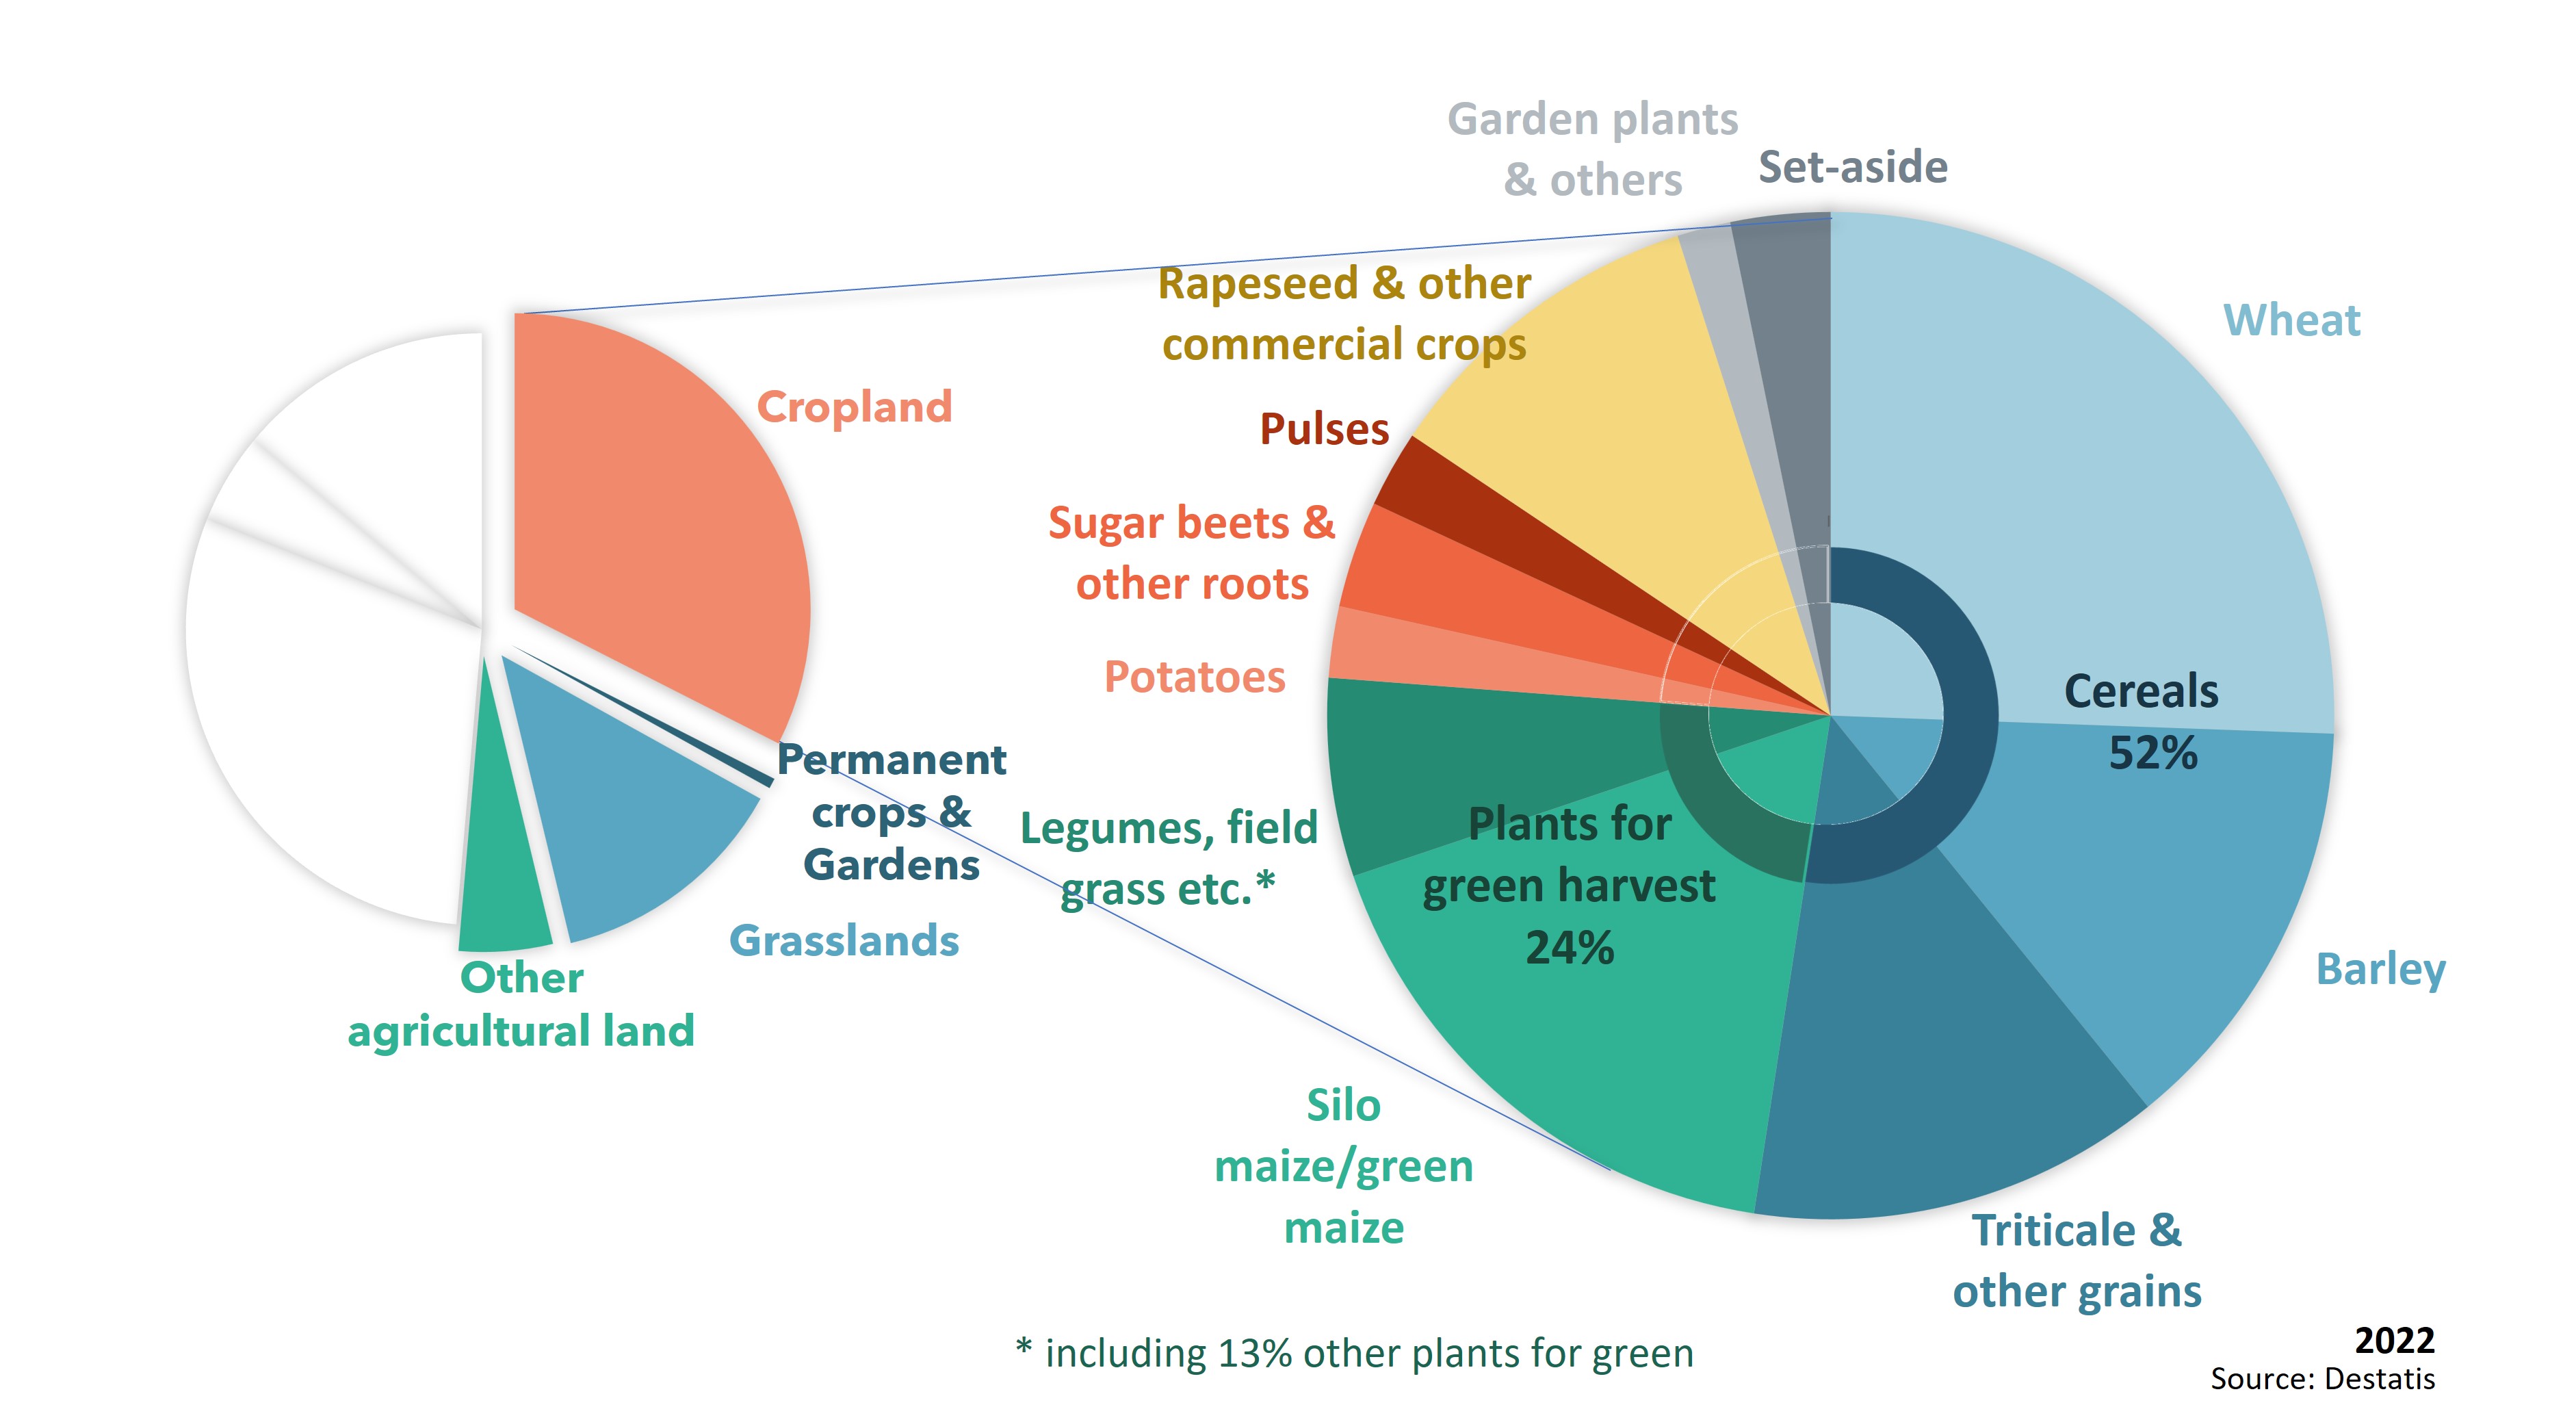
Agricultural land use with crop specifications.
(Source: own illustration and grouping of crops based on Destatis [1]).
What is produced by Germany’s agricultural sector?
The German agricultural sector is characterized by animal-based food production and a high share of livestock. Germany has the highest production of milk and pork in Europe [2], sourced mainly from the northwest and southeast parts of the country (see map). To sustain Germany’s livestock of over 12 million livestock units [3], 62% of the farmland is used to produce feed (2017) [2]. Read more under use and food and feed.
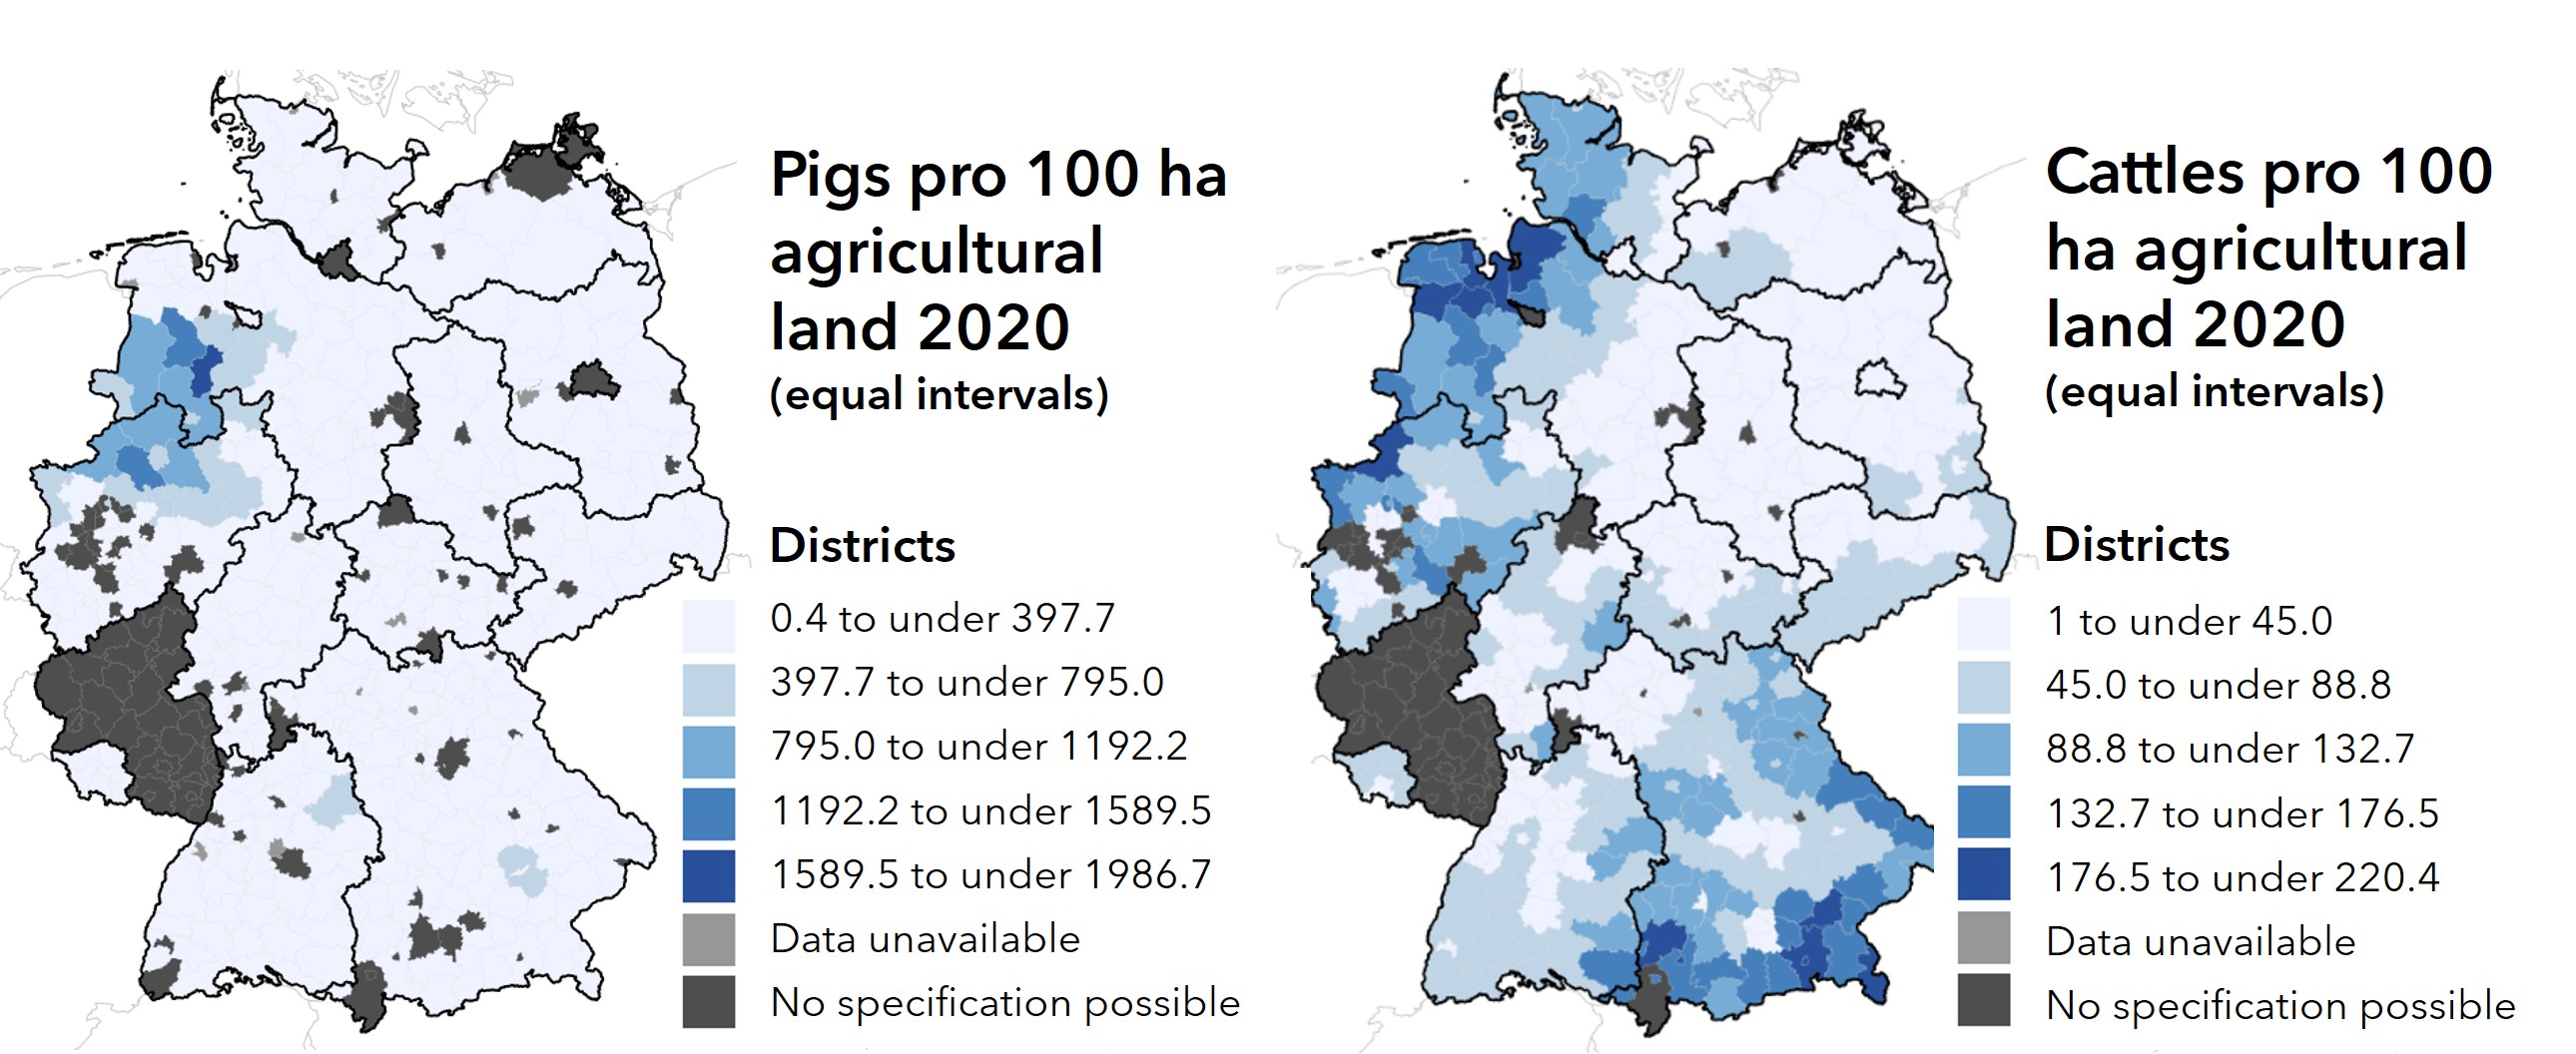
The geographical distribution of pigs (left) and cattle (right) in 2020 (equal intervals). Germany’s livestock is mainly in the northwest (pigs and cattle) and southeast (cattle) of the country. (Source: Destatis [5]).
Germany produces 17.8 million tonnes of milk, which corresponds to 121% of national consumption [6] and 6.5 million tonnes of cheese (125% of national consumption) [7]. Despite bypassing national consumption levels, it is not showing whether Germany’s farmers can self-sustain the national population with these products, as they largely depend on feed imports to their livestock [2]. Read more about hidden land and biomass dependency under national consumption footprint and below under imports and footprints. At the same time, Germany is a large exporter of agricultural products and particularly of milk and meat. The main plant-based food products produced in Germany are bread cereals, potatoes, sugar beet, fruit and vegetables [2].
Next to animal-based and plant-based food, more than a fifth - 2.54 million hectars - of the cropland is used to produce energy [10] and the remaining 2.5% is used for industrial purposes [11]. Since 2015, the land use for energy and industrial purposes has increased by 6% - 0.15 million hectars [10]. Read more about the energetic and material use of field crops under energy and materials.
What impact does agriculture have on German ecosystems?
Given that agricultural land covers half of Germany, land use and its management largely dictate the characteristics of many ecosystems. To support a more balanced interplay between agricultural production and other ecosystem services, a broad range of strategies have been implemented and/or recommended, including political measures (see below) as well as farming and land use practices (in particular organic farming). Yet, the highly industrialized agricultural sector is also connected to several environmental challenges at different landscape levels (from regional hotspots to national trends). Some examples include:
- A loss of insects affects pollination. Plant protectants, such as pesticides and fungicides constitute a stress factor for bees as well as hurdles for flora diversity [13]. There is a need to create more habitats for bees, including a broader variety of flowers.
- The preservation of a large biodiversity of animals and plants is based on intact habitats. However, sustainability indicators have been showing a decline in representative bird species in agricultural landscapes for years [14].
- Fertilizers, mainly nitrogen, help increase yields, but surpluses disturb the balance in surrounding ecosystems. The total nitrogen surplus shows the lowest levels since 1990 [15] but is not yet meeting 2030 targets of 70kg N/ha [16].
- Bare soils face gradual but large soil erosion. In Germany, the average soil erosion caused only by water is 1.8tonnes per hectare and year [17]. Thereby, also the nutrients and the hummus bonded in the topsoil are lost into the water, which is important for agricultural yields. At the same time, nutrients and pollutants in the soil are spread into neighboring waters and waterways [18].
Agriculture is responsible for 8 % of Germany’s greenhouse gas (GHG) emissions [19]. Particularly high GHG emissions come from the agricultural use of so-called organic soils [20], making up about 40% [21] of total emissions from agriculture and land use, although they only cover just below 8% of the agricultural area.
What is the extent of organic farming in Germany?
Organic farming seeks to limit the impacts on ecosystems by, for instance, avoiding plant protection and mineral-based fertilizers and instead imitating and strengthening desired ecological functions [22]. 11% of German agricultural area is cultivated according to organic practices (as of 2019) [23]. The current adopted national goal is 20% by 2030 [16], which according to the coalition agreement of the current government will be adjusted to 30% [25]. Although the current trend shows an increase in organic farming, it is unlikely that the already adopted goal will be reached without additional measures beyond the current strategy for the future of organic farming [26]. The land farmed organically is unevenly distributed across Germany (see map).
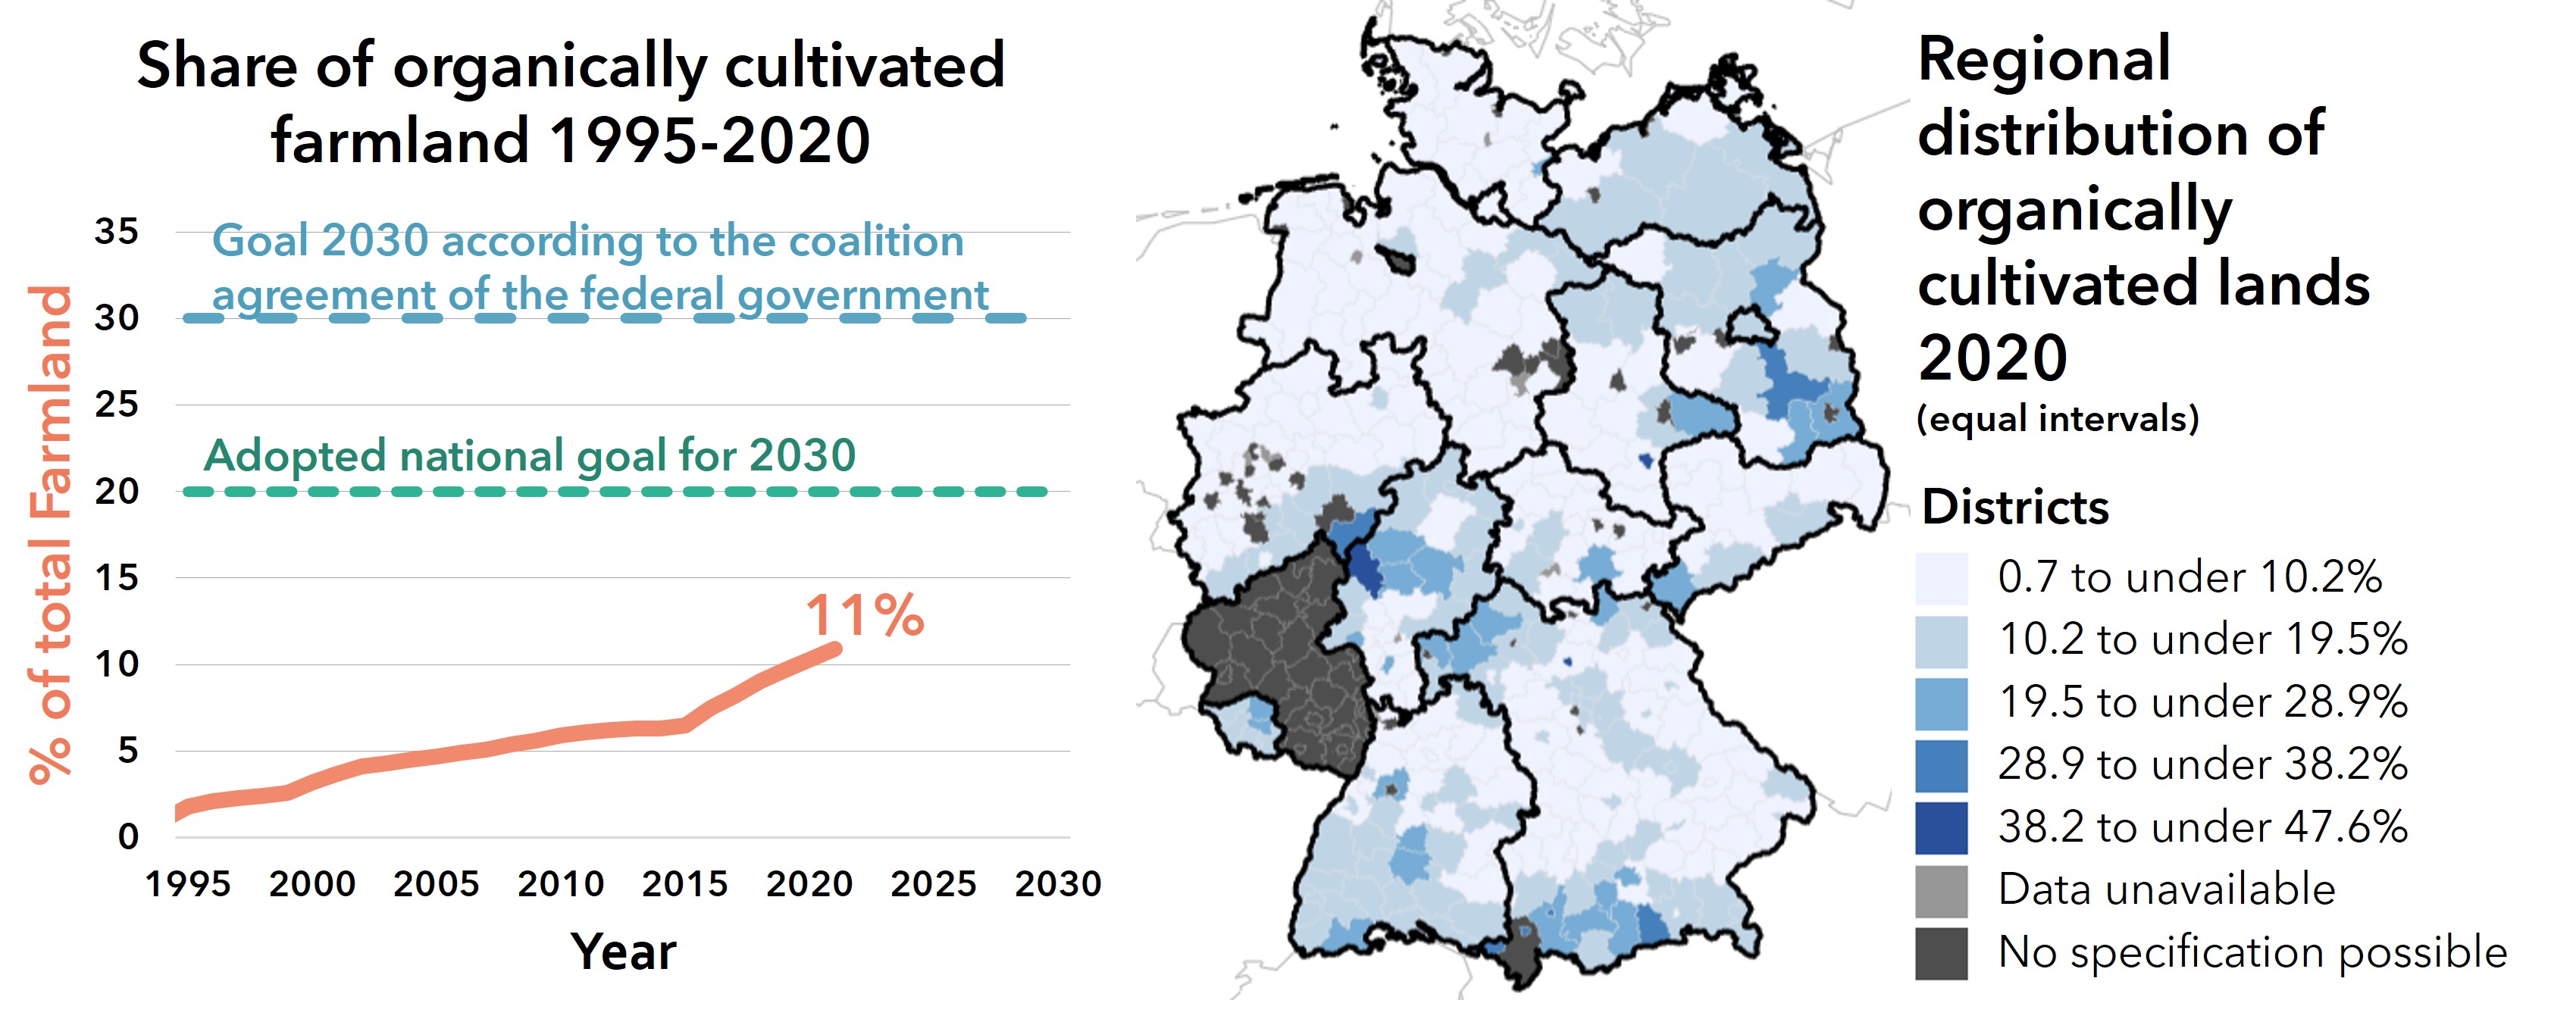
Increase of organically cultivated farmlands (1995-2021) and the regional distribution in 2020.
(Source: BMEL statistics [23] and Destatis [27]).
What measures help to mitigate environmental impacts linked to agricultural production?
Measures and strategies range from local adjustments in the management of specific lands (e.g. protecting a mountain meadow or using selected plants for field borders and slopes), to regional protection areas (e.g. biospheres) [28] and up to national and supranational policies addressing the framing conditions for agriculture (e.g. the new Common Agricultural Policy of the EU) [29].
In the design of political strategies, it is key to link several measures using a system perspective. For instance, the German Ministry of Food and Agriculture (BMEL) supports increased production of legumes to improve soil fertility, while also increasing the plant-based protein supply from domestic sources [31]. Diversifying land use is a key strategy to increase yields from organic farms or other fields with reduced inputs of fertilizers and plant protectors [30] and legumes have several environmental benefits [32], particularly in comparison to animal-based protein sources. The initiative thereby links to necessary dietary changes towards more plant-based diets, see food and feed. The EU “farm to fork strategy” [33] is another example of linking environmental problems with consumption patterns as it seeks to address system-wide and interrelated issues.
Additional national political initiatives to decrease the environmental pressure from agriculture include for instance:
- the 2035 arable farming strategy from 2019, which offers prospects to deal with conflicting goals, promoting measures such as diversifying crops, adjusted fertilization supported by digital technologies and a system perspective on plant protections and farming practices [34]
- A strategy for livestock (2019) aiming both at increased animal welfare and environmental protection. [35]
- A dedicated peatland conservation strategy (2022) [36], which is part of an action program for natural climate protection. [37]
- Since 2019, there is also an insect protection action program, including among other things an expansion of the biotope protection law to cover lean lowland, mountain meadows, orchards and stone walls [38].
What are some main challenges for the agriculture-based bioeconomy?
The increasing demand of agricultural biomass for diverse purposes in the bioeconomy and the additional market shocks induced by the Covid pandemic and war in Ukraine has intensified the debate of priority-setting for German agriculture [39]. In the last half century, agricultural policies have focused on affordable and sufficient food through intensification, trade and open global markets [40]. This production-efficiency oriented policy – of increased crop productivity and low prices – has been criticized for creating inefficiency in the food system as a whole [41], for being sensitive to disturbances and shocks [42] and causing environmental harms. Organic farming may offer an alternative pathway forward. However, with on average lower yields than conventional farming [43] the question is how much land can and should be converted to organic practices considering current food, energy, climate and biodiversity crises, or to what extent other strategies can fill this yield gap.
Imports and footprints
How much is harvested globally for German consumption?
In 2015, a person living in Germany consumed on average 2.4 tonnes of agricultural products per year [45]. These products have an agricultural biomass footprint of 3.9 tonnes. The agricultural biomass footprint is comprised of the weight of the products (food, fuel, materials) and all the agricultural biomass harvested to enable the production process, such as feed, grazed biomass, straw, husk and other crop residues [46]. The global average agricultural biomass footprint is 2.8 tonnes [47], making Germany’s agricultural biomass footprint around 30% higher than that of the world average.
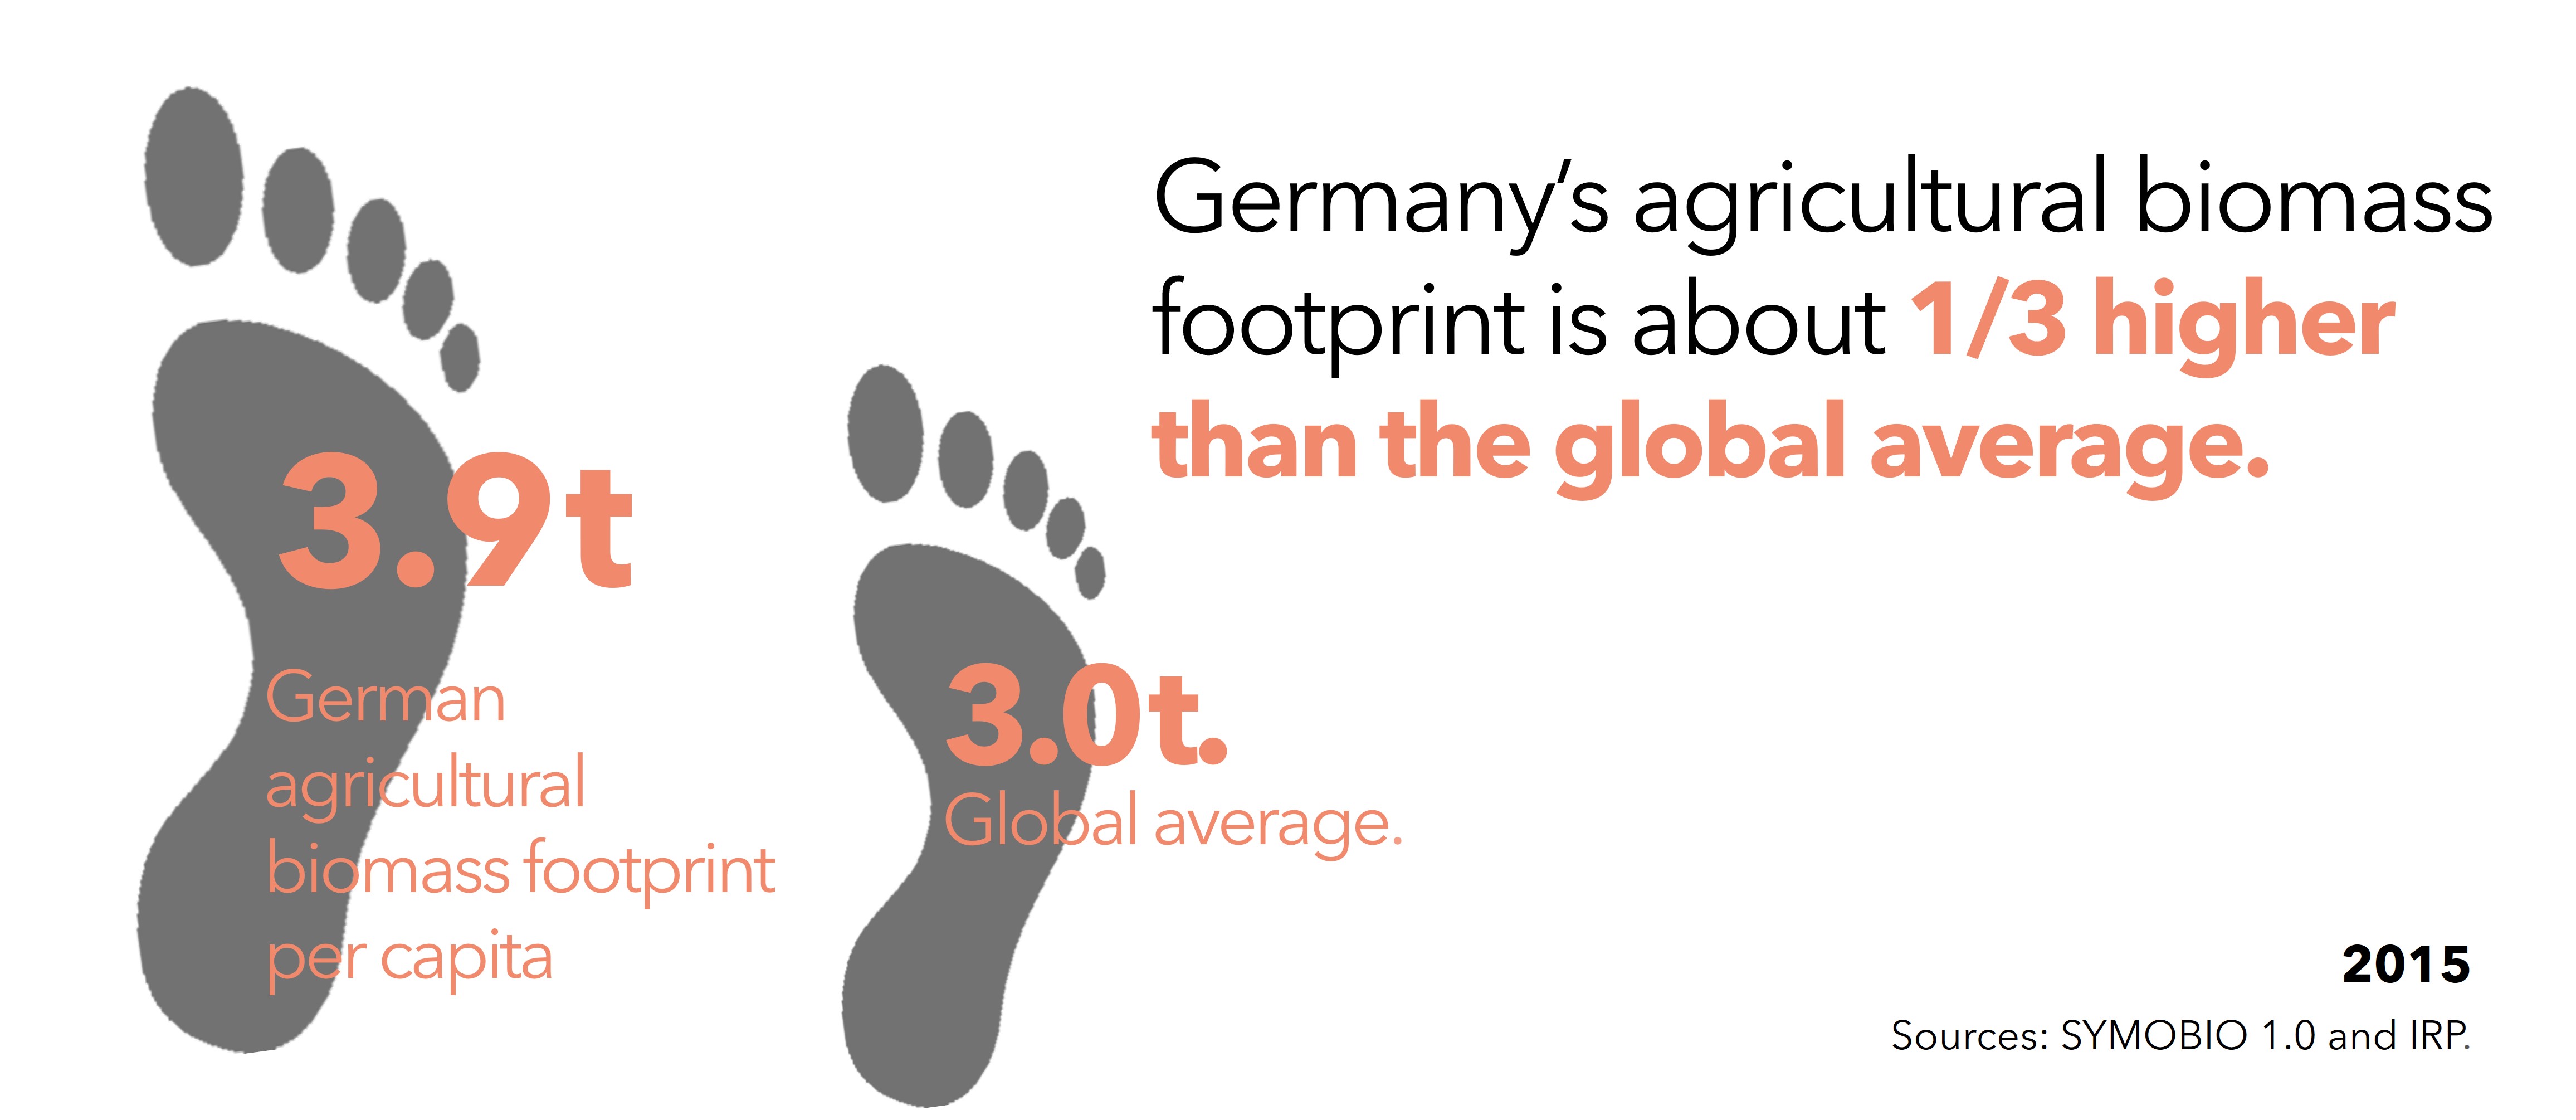
The agricultural biomass footprint of Germany and global average (Source: SYMOBIO 1.0 and IRP [48], icons: flaticon [49]).
The footprint is calculated as the imports in raw material equivalents [46] plus the domestic production (total harvest) minus exports in raw material equivalents [50].
What is the role of imports and trade?
Germany trades large amounts of agricultural goods and products. In physical quantities, Germany was the third largest importer of agricultural products in the world in 2020, following China and the United States. In the same year, Germany was also the 9th biggest exporter of agricultural goods and products in the world (following the United States, Brazil, Argentina, Canada, Ukraine, Russia, France and the Netherlands) [51]. Germany's direct imports (0.90 t per capita) are higher than the direct exports (0.76 t per capita), making Germany a net importer [52]. When considering also indirect imports and exports in terms of raw material equivalents, the difference is more pronounced. In 2015, the imports in raw material equivalents (2.5 t per capita) were almost double the exports (1.3 t per capita).
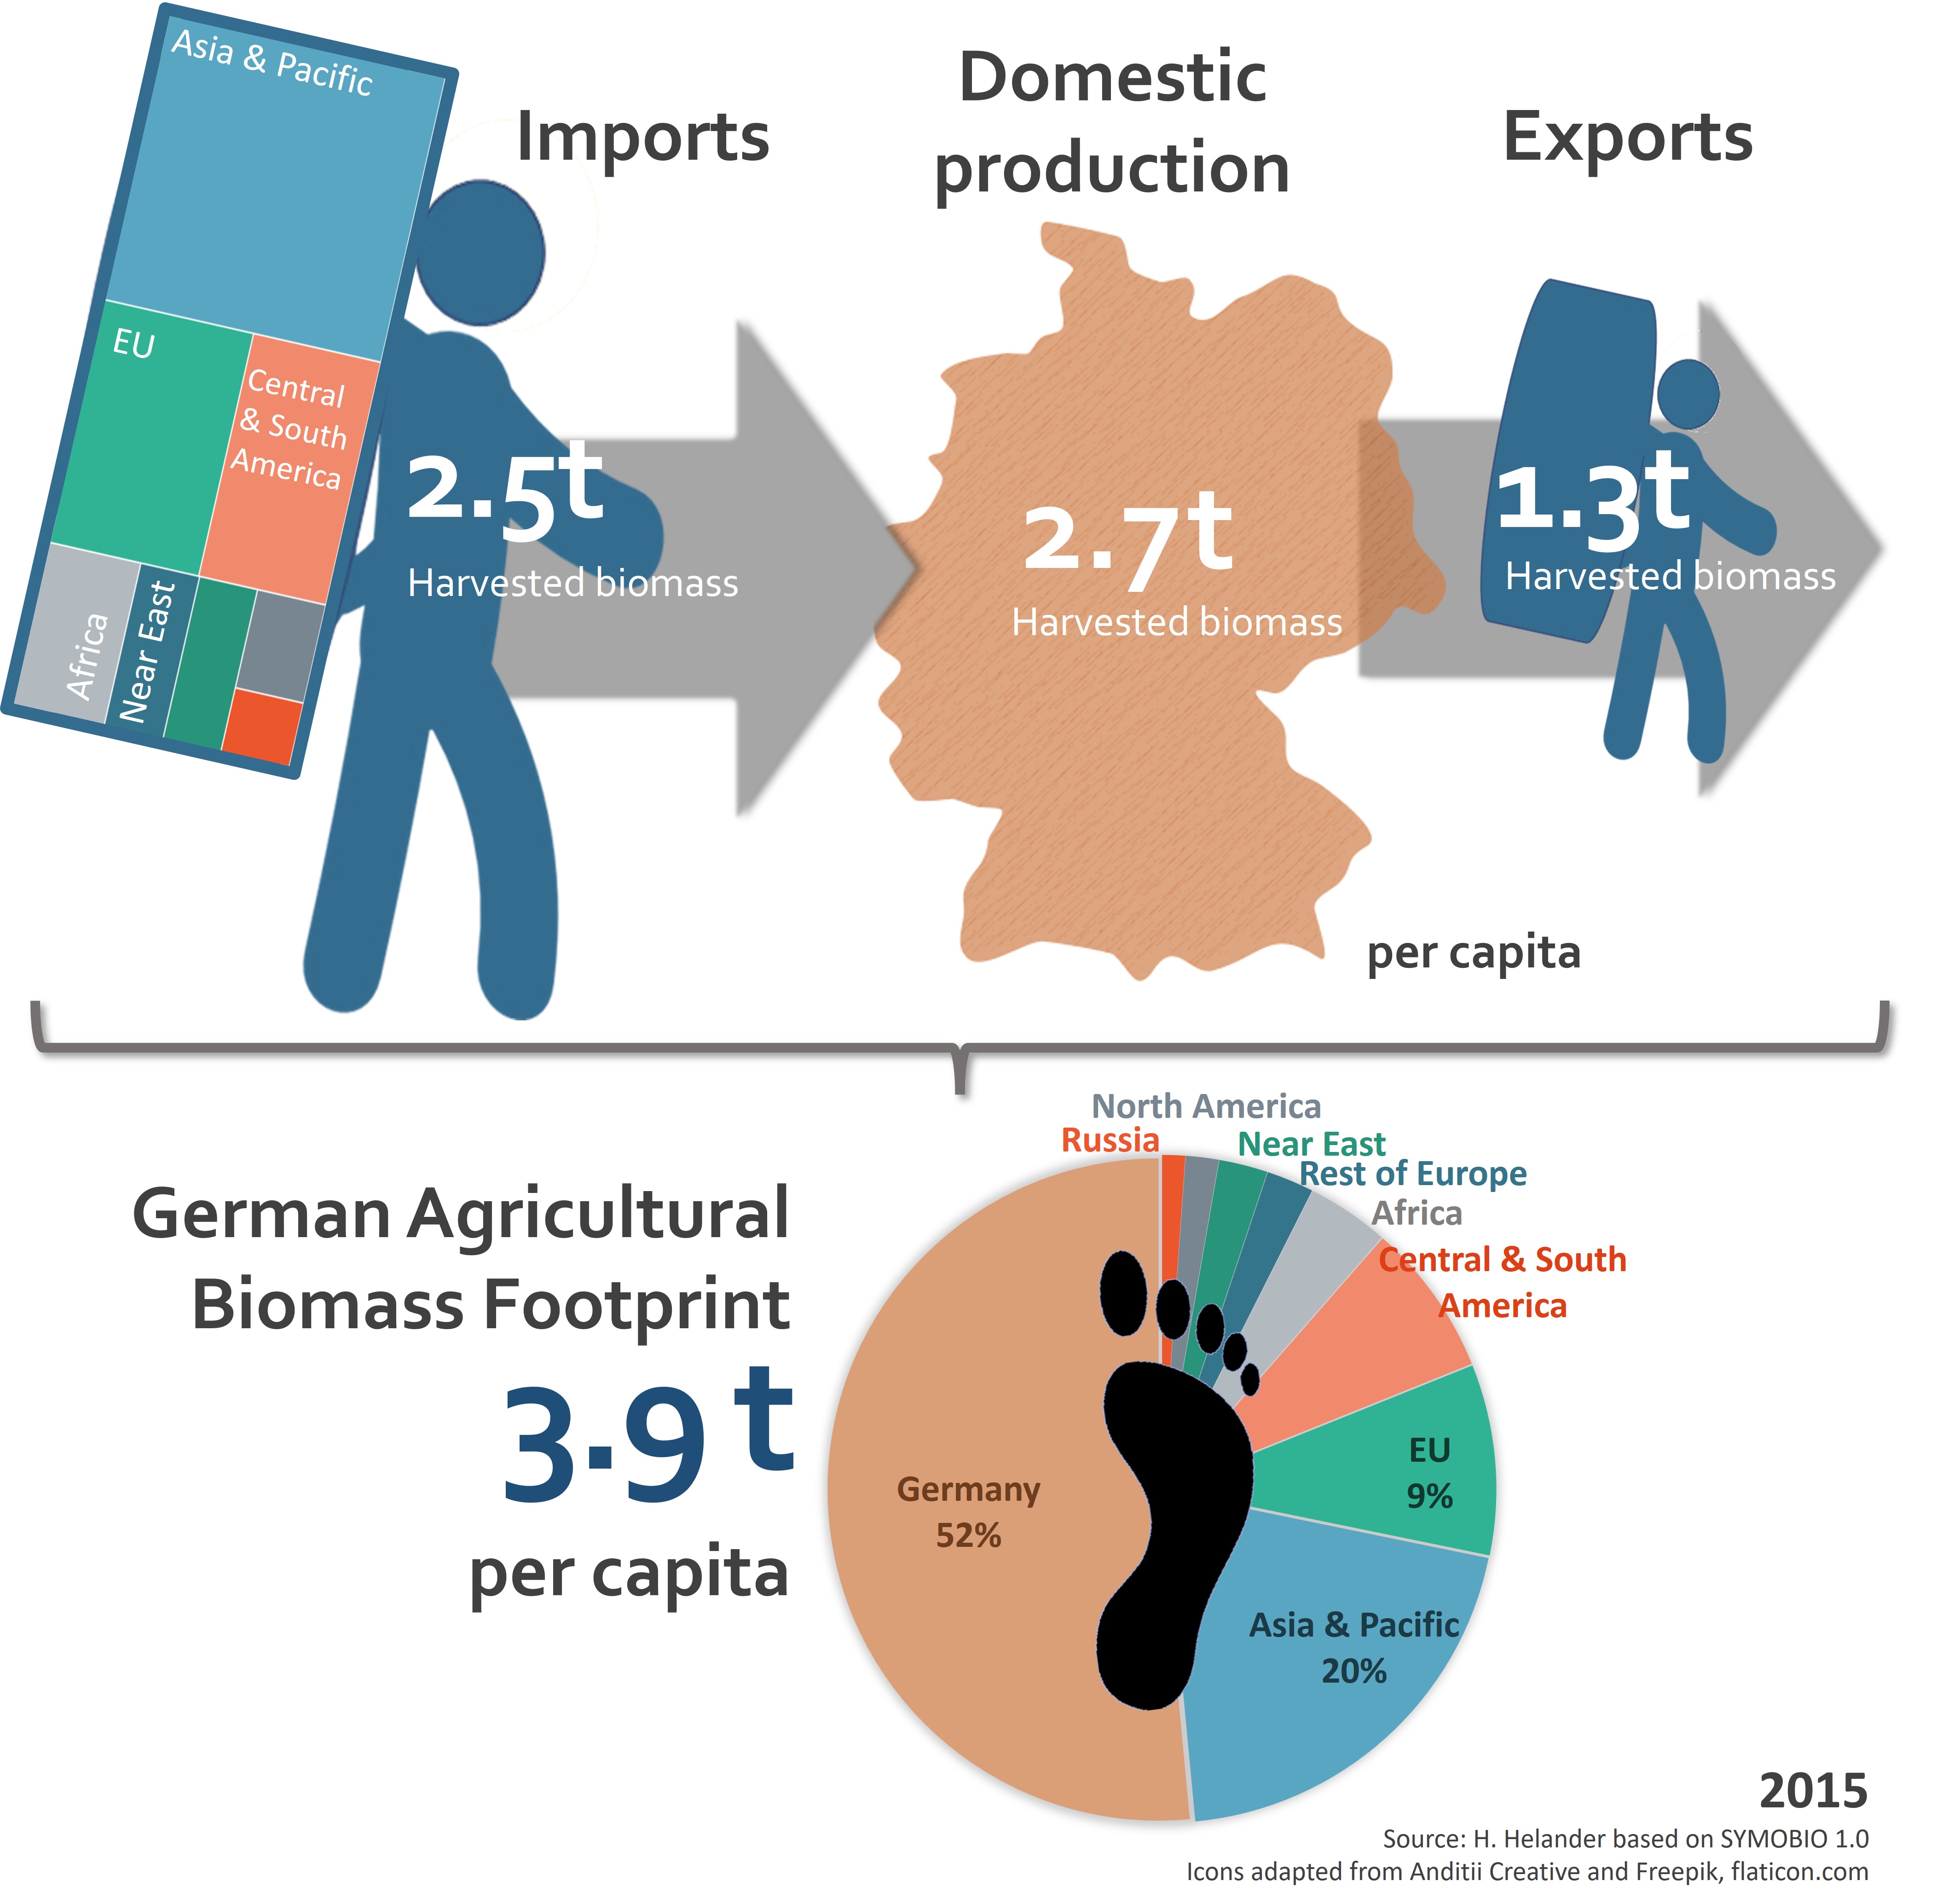
Germany’s trade balance of imports, exports and domestic
production in raw material equivalents [46] and the countries of origin [53].
(Source: Helander based on SYMOBIO 1.0. Icons are adapted from flaticon [49]).
Where does the biomass come from?
Around half of the German biomass footprint is sourced from within Germany and half from abroad. The largest share of imports stems from Asia and the Pacific (origin of 20% of the footprint), followed by the rest of the EU and Central and South America (with each region contributing to 9% of the German footprint origins) [53].
How much agricultural land is needed globally to meet Germany’s consumption levels?
The agricultural land footprint of German consumption was 0.62 hectares per person in 2015. The total area needed (51 Mha) is three times larger than the total agricultural area available within Germany (17 Mha) [53]. Although the per capita footprint is close to the global average of 0.60 hectares, about half (0,30 hectares) of the German agricultural land footprint is cropland use, which is the most intensive form of agricultural land use [54]. This puts Germany well above both average global cropland use (0.2 hectares in 2015) [54] and the suggested interim target value for a safe operating space of global cropland use (0.2 hectares per person in 2030) [55]. Read more in the benchmark section.
Notes and references
- Destatis (2022). Landwirtschaftliche Betriebe, Landwirtschaftlich genutzte Fläche: Deutschland, Jahre, Bodennutzungsarten. Table 41271-0003. Available at: https://www-genesis.destatis.de/genesis/online
- BMEL (2020). Understanding Farming. Available at: https://www.bmel.de/SharedDocs/Downloads/EN/Publications/UnderstandingFarming.html
- BMEL Statistics (2020). Landwirtschaftliche Betriebe mit Viehhaltung nach Großvieheinheiten. Table SJT-3100700-2020. Available at: https://www.bmel-statistik.de/fileadmin/daten/SJT-3100700-2020.xlsx
- Destatis (2021). Floor area total according to types of use in Germany. Available at: https://www.destatis.de/EN/Themes/Economic-Sectors-Enterprises/Agriculture-Forestry-Fisheries/Land-Use/Tables/areas-new.html; Destatis (2022). Landwirtschaftliche Betriebe, Landwirtschaftlich genutzte Fläche: Deutschland, Jahre, Bodennutzungsarten. Table 41271-0003. Available at: https://www-genesis.destatis.de/genesis/online
- Destatis (2022). Regionalatlas. „Rinder je 100 ha landwirtschaftlich genutzter Fläche“ and „Schweine je 100 ha landwirtschaftlich genutzter Fläche“. Available at: https://regionalatlas.statistikportal.de/
- Milk and milk products (excluding cheese). Calculated based on the sum of milk products. BMEL Statistics (2022). Versorgung mit Konsummilch und Milcherzeugnissen nach Kalenderjahren. Table MBT-0204160-0000. Available at: https://www.bmel-statistik.de/fileadmin/daten/MBT-0204160-0000.xlsx
- Referring to the sum of the cheese types. BMEL Statistics (2022): Versorgung mit Käse nach Kalenderjahren. Table MBT-0204360-0000. Available at: https://www.bmel-statistik.de/fileadmin/daten/MBT-0204360-0000.xlsx
- Destatis (2021). Floor area total according to types of use in Germany. Available at: https://www.destatis.de/EN/Themes/Economic-Sectors-Enterprises/Agriculture-Forestry-Fisheries/Land-Use/Tables/areas-new.html
- Farmland refers to cropland, grassland and permanent crops and gardens.
- BMEL Statistics (2022). Anbau nachwachsender Rohstoffe und Energiepflanzen. Table SJT-3071310-0000. Available at: https://www.bmel-statistik.de/fileadmin/daten/SJT-3071310-0000.xlsx
- 3 million hectares. This mostly consist of industrial starch from potatoes, maize and wheat. BMEL Statistics (2022). Anbau nachwachsender Rohstoffe und Energiepflanzen. Table SJT-3071310-0000. Available at: https://www.bmel-statistik.de/fileadmin/daten/SJT-3071310-0000.xlsx
- Four-year moving average 2017-2020. Destatis (2023). Flächenindikator "Anstieg der Siedlungs- und Verkehrsfläche". Available at: https://www.destatis.de/DE/Themen/Branchen-Unternehmen/Landwirtschaft-Forstwirtschaft-Fischerei/Flaechennutzung/Tabellen/anstieg-suv2.html; The land types converted are analyzed at: https://www.destatis.de/DE/Methoden/WISTA-Wirtschaft-und-Statistik/2021/06/oekosystemgesamtrechnungen-062021.html (see e.g. fig 6)
- Erbs et al. (2020). Expert Forum Bees and Agriculture. Researching synergies, developing solutions: research strategy of the German Agricultural Research Alliance. DAFA. Available at: https://www.dafa.de/wp-content/uploads/Brosch-DAFA-FF-Bienen-LaWi_en_klein.pdf
- Destatis (2021). Nachhaltige Entwicklung in Deutschland. Indikatoren Bericht 2021. Available at: https://www.destatis.de/DE/Themen/Gesellschaft-Umwelt/Nachhaltigkeitsindikatoren/Publikationen/Downloads-Nachhaltigkeit/indikatoren-0230001219004.pdf;jsessionid=B256BD826CA12E50CE6239001DC4558A.live712?__blob=publicationFile
- The average 2018 to 2020 was 82 kg N/ha. BMEL (2021). Statistischer Monatsbericht des Bundesministeriums für Landwirtschaft und Ernährung, Kapitel A. Landwirtschaft. Table MBT-0111260-0000 Nährstoffbilanz insgesamt von 1990 bis 2020. Available at: https://www.bmel-statistik.de/landwirtschaft/statistischer-monatsbericht-des-bmel-kapitel-a-landwirtschaft
- The Federal Government (2021). German Sustainable Development Strategy. Available at: https://www.bundesregierung.de/resource/blob/974430/1940716/6a4acf041217d39bac6a81cce971381f/2021-07-26-gsds-en-data.pdf?download=1
- Eurostat (2019). Estimated soil erosion by water, by erosion level, land cover and NUTS 3 regions (source: JRC). Available at: https://ec.europa.eu/eurostat/web/products-datasets/-/aei_pr_soiler
- BMEL (2019). Zukunftsstrategie ökologischer Landbau: Impulse für mehr Nachhaltigkeit in Deutschland. Available at: https://www.bmel.de/SharedDocs/Downloads/DE/Broschueren/ZukunftsstrategieOekologischerLandbau2019.html
- UBA (2022). Table 2022_03_15_trendtabellen_thg_nach_sektoren_v1.0. Berichterstattung unter der Klimarahmenkonvention der Vereinten Nationen und dem Kyoto-Protokoll 2022: Nationaler Inventarbericht zum Deutschen Treibhausgasinventar 1990 – 2020. Available at: https://www.umweltbundesamt.de/sites/default/files/medien/361/dokumente/2022_03_15_trendtabellen_thg_nach_sektoren_v1.0.xlsx
- Organic soils refer to soils with a significant amount of organic material from plant remains
- UBA (2022). Berichterstattung unter der Klimarahmenkonvention der Vereinten Nationen und dem Kyoto-Protokoll 2022. Nationaler Inventarbericht zum Deutschen Treibhausgasinventar 1990 – 2020. Available at: https://www.umweltbundesamt.de/sites/default/files/medien/1410/publikationen/2022-05-31_climate-change_24-2022_nir-2022_de.pdf
- BMEL (2022). Organic Farming in Germany. Available at: https://www.bmel.de/SharedDocs/Downloads/EN/Publications/Organic-Farming-in-Germany.pdf?__blob=publicationFile&v=4
- BMEL Statistics (2021). Betriebe und Flächen des Ökologischen Landbaus. Table SJT-3071610-0000. Available at: https://www.bmel-statistik.de/fileadmin/daten/SJT-3071610-0000.xlsx
- The Federal Government (2021). German Sustainable Development Strategy, Update 2021. Available at: https://www.bundesregierung.de/resource/blob/974430/1940716/6a4acf041217d39bac6a81cce971381f/2021-07-26-gsds-en-data.pdf?download=1
- SPD (2021). Koalitionsvertrag 2021 – 2025 zwischen der Sozialdemokratischen Partei Deutschlands (SPD).
- BMEL (2019). Zukunftsstrategie ökologischer Landbau: Impulse für mehr Nachhaltigkeit in Deutschland. Available at: https://www.bmel.de/SharedDocs/Downloads/DE/Broschueren/ZukunftsstrategieOekologischerLandbau2019.pdf?__blob=publicationFile&v=5; Bringezu et al. (2021). Pilot report on the monitoring of the German bioeconomy. doi: 10.17170/kobra-202201115406
- Destatis (2022). Regionalatlas. “Ökologischer Landbau“. Available at: https://regionalatlas.statistikportal.de/
- Read more at: BfN. Schutzgebiete. Available at: https://www.bfn.de/schutzgebiete (only available in German)
- More informations available at: https://agriculture.ec.europa.eu/common-agricultural-policy/cap-overview/new-cap-2023-27_en
- Ponisio et al. (2015). Diversification practices reduce organic to conventional yield gap. Biologic. sci. doi: 10.1098/rspb.2014.1396
- BMEL (2020). Beans, Peas & Co.: The Federal Ministry of Food and Agriculture‘s Protein Crop Strategy for promoting the cultivation of pulses in Germany. Available at: https://www.bmel.de/SharedDocs/Downloads/EN/Publications/beans-peas.pdf?__blob=publicationFile&v=2
- Stagnari et al. (2017). Multiple benefits of legumes for agriculture sustainability: an overview. Biol. Technol. Agric. doi: 10.1186/s40538-016-0085-1
- European Commission (2020). Farm to Fork Strategy: For a fair, healthy and environmentally-friendly food system. Available at: https://food.ec.europa.eu/system/files/2020-05/f2f_action-plan_2020_strategy-info_en.pdf
- Federal Ministry of Food and Agriculture, BMEL (2019). 2035 Arable Farming Strategy. Available at: https://www.bmel.de/SharedDocs/Downloads/EN/Publications/ackerbaustrategie-en.pdf?__blob=publicationFile&v=6
- BMEL (2019). Nutztierstrategie. Available at: https://www.bmel.de/SharedDocs/Downloads/DE/Broschueren/Nutztierhaltungsstrategie.pdf?__blob=publicationFile&v=9
- BMUV (2022). Nationale Moorschutzstrategie. Available at: https://www.bmuv.de/download/nationale-moorschutzstrategie
- BMUV (2022). Federal Action Plan on Nature-based Solutions for Climate and Biodiversity. Available at: https://www.bmuv.de/en/download/federal-action-plan-on-nature-based-solutions-for-climate-and-biodiversity
- BMUV (2019). Aktionsprogramm Insektenschutz: Gemeinsam wirksam gegen das Insektensterben. English summary available at: https://www.bmuv.de/fileadmin/Daten_BMU/Download_PDF/Artenschutz/eckpunkte_insektenschutz_en_bf.pdf
- See for instance https://www.swp-berlin.org/publikation/ukraine-krieg-und-ernaehrungssicherheit-umsichtige-food-first-strategie-fuer-den-herbst-entwickeln. It is already defined as a key points in the upcoming biomass strategy (available at: https://www.bmel.de/SharedDocs/Meldungen/DE/Presse/2022/221006-biomassestrategie.html). See also from FAO (2021). The State of Food and Agriculture 2021. Available at: https://www.fao.org/documents/card/en/c/cb4476en
- The EU common agricultural policy (CAP) seeks to increase productivity, stabilize markets, ensure the availability of food at affordable prices and provide a fair living for farmers, see for instance European Comission. Feeding Europe: 60 years of common agricultural policy. Available at: https://www.consilium.europa.eu/en/60-years-of-common-agricultural-policy/
- Benton and Bailey (2019). The paradox of productivity: agricultural productivity promotes food system inefficiency. Glob. Sustain. doi: 10.1017/sus.2019.3
- Tendall et al. (2015). Global Food Security. Available at: https://www.zef.de/fileadmin/user_upload/qle_download_Tendall%20et%20al.%202015.pdf; Béné (2020). Resilience of local food systems and links to food security – A review of some important concepts in the context of COVID-19 and other shocks. Food sec. doi: 10.1007/s12571-020-01076-1; FAO (2022). The State of the World’s Land and Water Resources for Food and Agriculture – Systems at breaking point (SOLAW 2021). Available at: https://www.fao.org/3/cb7654en/online/cb7654en.html.
- de Ponti et al. (2012). The crop yield gap between organic and conventional agriculture. Agric. Syst. Available at: doi: 10.1016/j.agsy.2011.12.004; Seufert et al. (2012). Comparing the yields of organic and conventional agriculture. Nat. doi: 10.1038/nature11069.
- BMUV (2016). Shaping Ecological Transformation – Integrated Environmental Programme 2030. Available at: https://www.bmuv.de/publikation?tx_bmubpublications_publications%5Bpublication%5D=321&cHash=8da7825a9af17fc1da08cf6cd770dd0c
- Direct material consumption (DMC) 2015, including animal-based food. Destatis, Gesamtwirtschaftliches Materialkonto, https://www.destatis.de/DE/Themen/Gesellschaft-Umwelt/Umwelt/UGR/rohstoffe-materialfluesse-wasser/Publikationen/Downloads/gesamtwirtschaftliches-materialkonto-xlsx-5851315.xlsx?__blob=publicationFile, Download Mar. 2nd, 2023
- In Material Flow Analysis, the harvested or grassed biomass that is needed to produce food is referred to as the “Raw Material Equivalents” (RME). When calculated for the consumption in a certain region it is called “Raw Material Consumption” (RMC) or just material footprint (of agricultural biomass).
- Bringezu et al. (2021): Environmental and socioeconomic footprints of the German bioeconomy. In Nat Sustain. DOI: 10.1038/s41893-021-00725-3.
- German footprint: SYMOBIO 1.0., SYMOBIO Data explorer, “Material”, https://symobio.uni-kassel.de (accessed 15 March 2023). Global average: IRP (International Resource Panel), Global Material Flow Database, https://www.resourcepanel.org/global-material-flows-database (accessed 20 March 2023)
- Icons adjusted from www.flaticon.com. Footprint and trip icon originally made by Freepik. German map originally made by Anditii Creative.
- The terms are illustrated in the figure below, which gives: imports in RME (2.5t) + domestic extraction (2.7t) – exports in RME (1.3t) = Biomass consumption footprint of 3.9t. RME= Raw Material Equivalents.
- According to FAOSTAT trade data for 2020, excluding live animals. Downloaded from https://www.fao.org/faostat/en/#data/TCL 2/2/2023. Note that the war in Ukraine has changed the global trade patterns, in particular Ukrainian exports.
- Agricultural products including animals and animal-based food. Destatis, Gesamtwirtschaftliches Materialkonto, https://www.destatis.de/DE/Themen/Gesellschaft-Umwelt/Umwelt/UGR/rohstoffe-materialfluesse-wasser/Publikationen/Downloads/gesamtwirtschaftliches-materialkonto-xlsx-5851315.xlsx?__blob=publicationFile)
- In raw material equivalents, RME. SYMOBIO 1.0, https://symobio.uni-kassel.de/(accessed 15 March 2023)
- Bringezu et al. (2021): Environmental and socioeconomic footprints of the German bioeconomy. In Nat Sustain. DOI: 10.1038/s41893-021-00725-3.
- UNEP (2014). Assessing Global Land Use: Balancing Consumption with Sustainable Supply. International Resource Panel. Available at: https://www.resourcepanel.org/reports/assessing-global-land-use