")
")
What is remote sensing I How is remote sensing used to contribute to a sustainable bioeconomy? I What are the limitations? I Case studies
What is remote sensing?
Remote sensing is the science, technology and art of observing an object, scene, or phenomenon by instrument-based technique at a distance without physical contact [1]. In other words, remote sensing allows the collection of information about an object without making a physical contact with it [2]. In a similar way that humans use their vision to gather certain information about an object (e.g. its colour, shape or size) without touching it, the remote sensing cameras and scanners are used as sensors to obtain data about the objects on the earth’s surface (e.g., forests, crop fields, water bodies, infrastructure objects) without physical contact to them. Satellites, aeroplanes and drones are used as common platforms to carry those sensors. The remote sensors’ output is usually in a form of image or photograph, which can be further processed to extract information about the observed objects.
Remote sensing camera captures reflected or emitted electromagnetic energy from the observed object. According to objects' biochemical composition and surface characteristics, the amount of energy reflected by objects is different. For example, healthy green leaves reflect green light (that is why we see leaves as green), but most of the red and blue light is absorbed for photosynthesis. Therefore, the acquired remote sensing images can be used to differentiate objects (e.g., water, trees, buildings) and quantify the object's bio-physical parameters (e.g., biomass). Supervised and unsupervised modellings (both classification and regression) are employed to retrieve that information from remote sensing images. Machine and deep learning modelling techniques are usually utilised with remote sensing images for accurate information extraction. The retrieved information (e.g., land-use land-cover, amount of biomass) can be further employed for spatial analysis using geographic information system (GIS) to assess the relationship with other climatic (e.g., temperature, precipitation), socioeconomic (e.g., population, income) and ecologic (e.g., species abundance) parameters.
Initially developed for the military purposes, remote sensing today is widely used also for civil applications. A range of environmental variables can be measured with remote sensing techniques in the atmosphere, over the land and the water. Therefore, remote sensing is applied in a large number of disciplines, including, but not limited to agriculture and crop monitoring, archaeology, cartography, civil engineering, climatology, disaster monitoring and prediction, forestry, geology, meteorology, oceanography, pollution monitoring, soil characterisation, urban mapping, and water resource mapping and monitoring [2].
How is remote sensing used to contribute to a sustainable bioeconomy?
Considering its wide range of uses, remote sensing can be well applied to assist the transition to sustainable bioeconomy, and to monitor its impacts and results. For example, remote sensing is used to capture:
- Land cover and land use at different spatial scales and resolutions enabling representations on global, regional, national and/or local levels;
- Land cover and land use change to observe its temporal dynamics;
- Vegetation (e.g. of croplands, grasslands [3], forests, peatlands), including characterising the type of vegetation, yields and its state of health;
- Environmental impacts, for example, monitoring of illegal logging, forest fires, impacts of floods, erosion and droughts;
- State of biodiversity and other ecosystem services.
Therefore, remotely sensed data can be used, for example, to estimate biomass potential, for calculation of carbon sinks of forest biomass [4], for monitoring of land use and land use change impacts of bioeconomy activities (e.g. land use change associated to biofuel production, extent of deforestation, etc.). Furthermore, remote sensing provides important data for precision agriculture applications and thus may contribute to sustainable intensification of agriculture. To ensure the sustainability of bioeconomy activities, remote sensing is increasingly used for monitoring environmental impacts, for example, changes in biodiversity [5] [6] [7], state of protected areas [8] and pollution [9]. Some case studies of using remote sensing for bioeconomy monitoring can be found below.
What are the limitations?
Although remote sensing technologies have been continuously developing over the last 50 years, there are still several challenges to cope with. For example, technical limitations in terms of resolution, coverage and cloud cover – in particular in case of the satellite based remote sensing [10]. Obtaining the higher resolution images imposes additional costs as high resolution satellite images are mostly available at extra charge, or specialised equipment (drones, cameras, sensors, computing power) has to be purchased to gather high-resolution information on the local scale.
Further challenges are concerning validation and transferability of remote sensing data models. Validation requires field data. However, it is often complicated, expensive or even impossible to obtain the necessary information on the ground. For example, when validating data models based on satellite images from the past decades. Transferability of the models developed and validated in a particular location to other locations and scales is another significant challenge. The transferability challenge will be addressed by one of the case studies below, where a land use change monitoring model developed for North Hesse will be applied to the larger Weser-Ems region in Germany.
Case studies
Remote sensing (RS) for monitoring of biogas sector induced land use and biodiversity change in North Hesse (Germany)
Background
In search for sustainable alternatives to fossil-based resources in the bioeconomy sectors, the demand and use of biomass in the last decades have been consistently increasing. Not only biomass residues have been steadily mobilized, but also the cultivation areas of dedicated crops for energy and industrial processes have been expanding. These developments are often associated with land use change and in many cases negatively impact the environment and biodiversity. This case study investigated the influence of agricultural biogas sector development on land use and biodiversity in North Hesse in Germany.
Starting from the year 2004, the number and capacities of agricultural biogas plants in Germany have been significantly increasing. This development resulted from the favourable legislative framework and financial incentives set in the Renewable Energy Law (EEG) in early 2000. The support for energy crop-based biogas plants has led to a significant increase in maize cultivation areas. These developments have been controversially discussed, particularly due to the risks of increased soil erosion, nitrogen losses and a decrease in biodiversity.
Methods
This case study applied RS methods to assess and monitor the state and changes of land use concerning biogas production developments. Multi-temporal and multi-sensor-based satellite (Landsat and Sentinel-2) data in combination with land use data collected by farmers for reporting in the Common Agricultural Policy framework of the European Commission (InVeKoS data) have been used to obtain the field level cropping information in North Hesse in 2000-2015. In addition, the data on biogas plants (installed average capacity at the municipal level) has been collected. The following indicators were assessed:
- Development of maize and winter cereal cultivation areas – both are preferred substrates for biogas production;
- Development of grassland areas – as an indicator of biodiversity;
- Development of the field structure and size – as an indicator for structural diversity.
The latest indicator was assessed using the parameter called “edge density”. The bigger the size of the field, the lower the biodiversity and related habitats in the landscape.
Results and conclusions
The results showed that the cultivation areas of summer crops (other than maize) and grasslands in the period between 2000 and 2015 have decreased. At the same time, the cultivation areas of maize and winter crops increased (see Figure 1(A)).
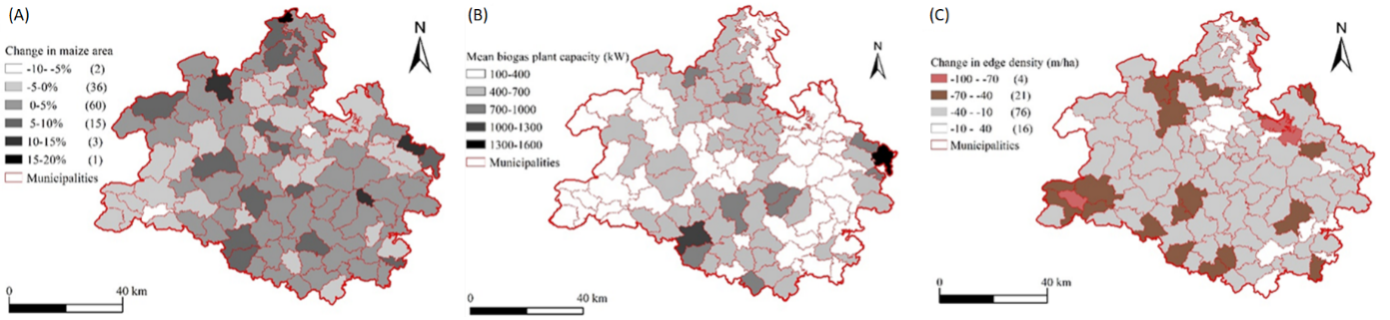
Change in maize area (A), mean biogas plant capacity (B) and change in edge density (C) on municipal level in 2000-2015 in North Hesse
Moreover, with an increasing average size of the biogas plants, the reduction of structural diversity has been decreasing (see Figure 2). It means that by smaller biogas plants, higher changes of the field structure have been observed. In North Hesse, in the frame of EEG, mostly smaller farm-based biogas plants have been installed (often only 1-2 per municipality). However, they have contributed to significant structural changes.
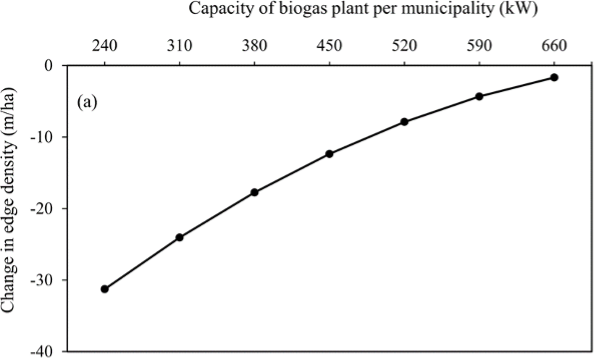
Change in “edge density” as parameter of structural diversity depending on the mean installed electrical capacity of biogas plants per municipality
Biogas plants of higher capacities are usually developed around larger field structures which already exist before the biogas plant installation. Therefore, the edge density changes in this case are less significant.
This study showed that developed models and RS-based methods are well applicable for monitoring and documenting land use change in the context of biogas sector development. Furthermore, the changes in cultivated crops or structural changes can be successfully evaluated and linked to biodiversity monitoring.
References
Further information about the background of the case study, applied methodology and results can be found in the following publications [11].
Brazil, Indonesia, Malaysia: Remote sensing for monitoring of the bioeconomy
Efficient and accurate monitoring of the bioeconomy must be extended to the beginning of the supply chain, including biomass production at the farm, plantation, and forestry levels [12]. This is where land use change and deforestation occur, and on-site monitoring via remote sensing can help to ensure that biomass production does not conflict locally with no-deforestation objectives and the protection of high carbon stock areas.
In a case study, remote sensing technology was implemented to identify how satellite-based land use change detection contributes to bioeconomy monitoring. As land use change caused by an extension of agricultural areas is the main driver for carbon stock and biodiversity losses [13], the use of satellite images are an indispensable element of bioeconomy monitoring. For this, relevant datasets and satellite images were gathered and a methodology to detect land use change and varying land management intensities based on Landsat images was developed, focusing on four pilot regions in Brazil, Indonesia, and Germany in the timeframe 2007 – 2016.
The results in the pilot area in Brazil showed that a total of 2,110,607 hectares of forest were converted to annual cropland and managed pasture between 2008 and 2017. The highest deforestation rate occurred in 2012, as shown in the figure below:
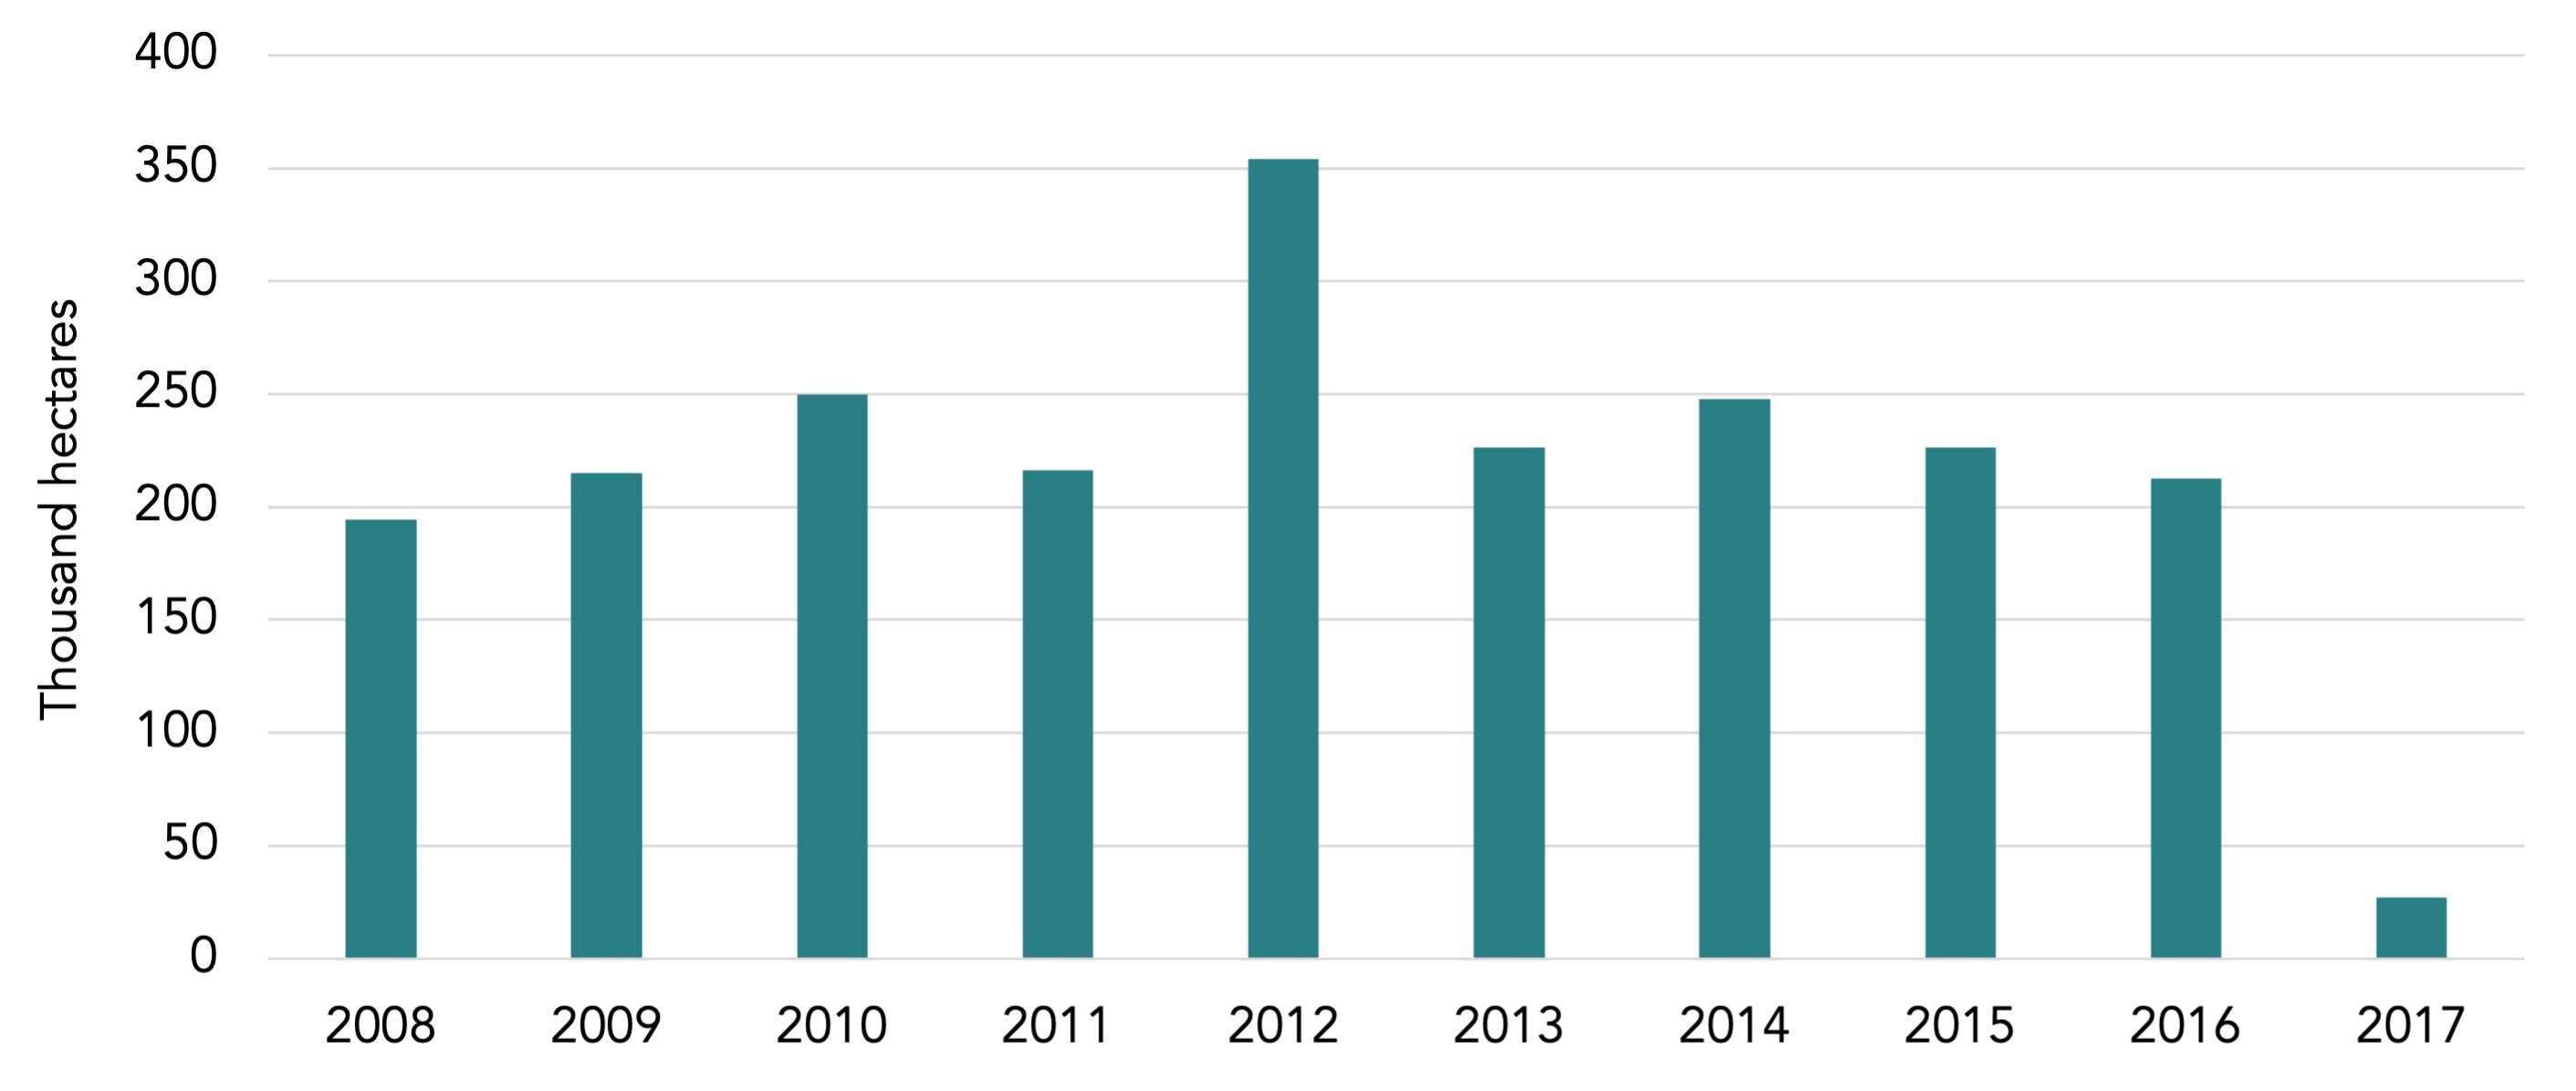
Deforestation in the pilot region in Brazil per year (Source: Based on data from the SYMOBIO project (ongoing work by GRAS) and Helka et al. (2020) [13]).
Likewise, in the pilot area in Kalimantan the forest that was converted to plantation was assessed annually between 2007 and 2017. A total of 7,199,459 ha of tree cover loss has been detected, including deforestation and replanting activities. Replanting activities of palm, rubber, etc. plantations have been detected and separated from the deforestation, resulting in 6,451,363 ha of actual deforestation.
This result shows how remote sensing can support the distinction of different land use change, and how accounting for replanting is important for proper deforestation reporting. The study also found that deforestation assessment can be conducted annually for state, municipality, or any other administrative level suitable for bioeconomy monitoring (see the figure below).
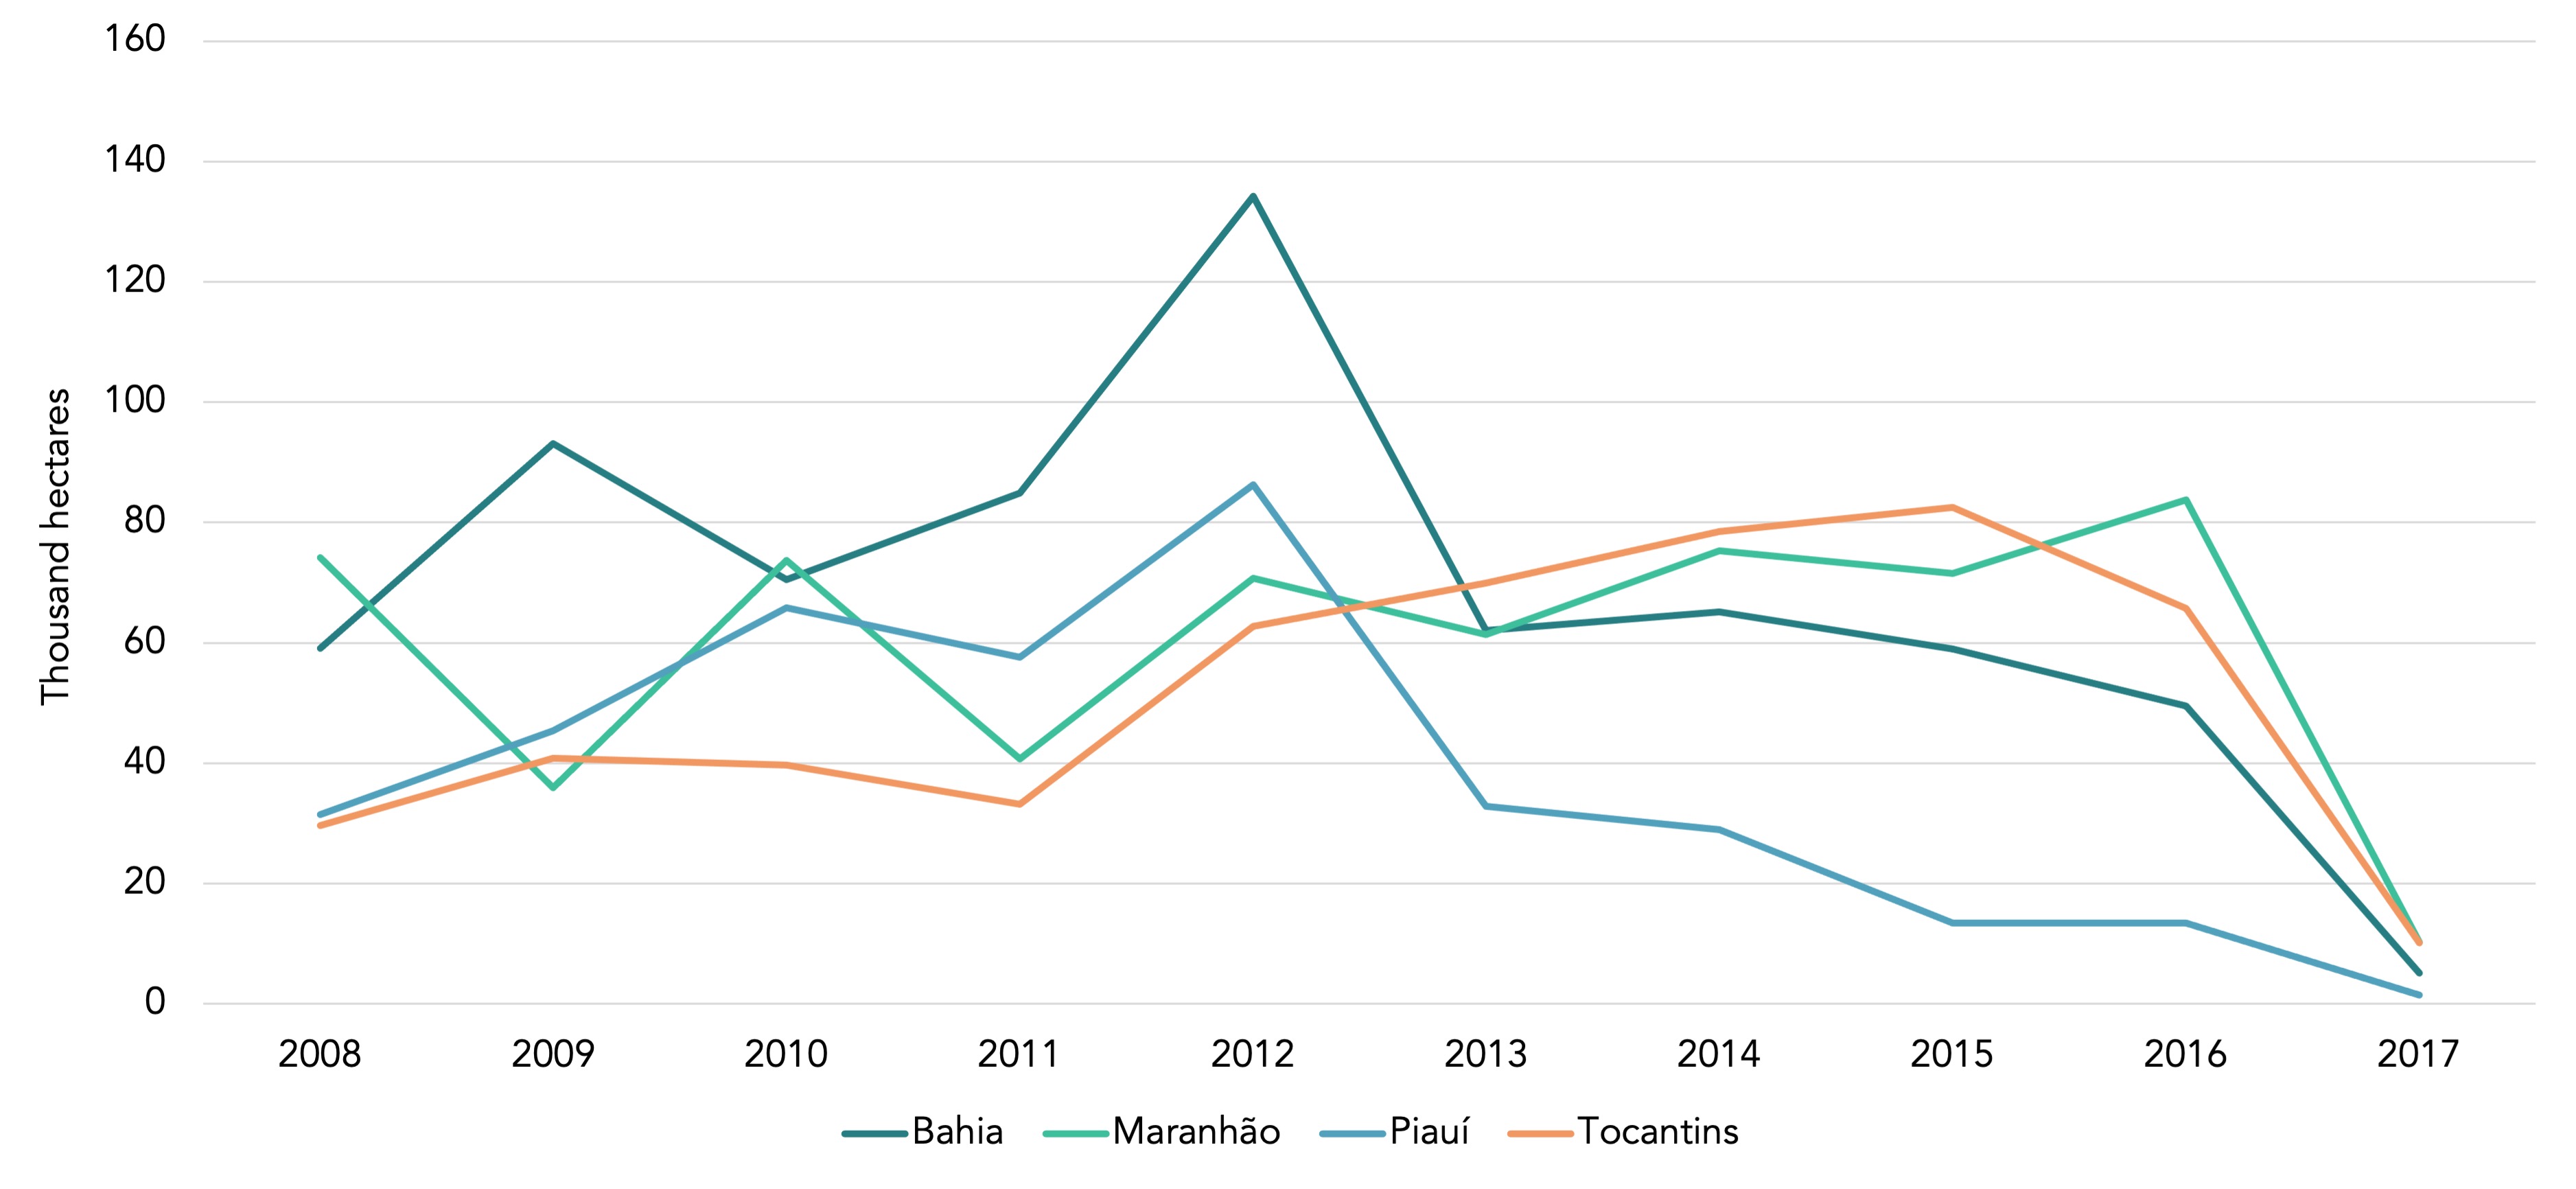
Selected states of Brazil showing the deforestation over time (Source: Based on data from the SYMOBIO project (ongoing work by GRAS) and Helka et al. (2020) [13]).
Based on these findings, GRAS is now developing an integrated, semi-automated system based on remote sensing to monitor the expansion of cropland and pasture into forests and natural grasslands at the country and regional levels.
Notes and references
- Tempfli et al. (2009). Principles of remote sensing : an introductory textbook. Available at: http://www.itc.nl/library/papers_2009/general/PrinciplesRemoteSensing.pdf.
- Rees (2012). Physical Principles of Remote Sensing (3rd). doi: 10.1017/CBO9781139017411.
- Wachendorf et al. (2018). Remote sensing as a tool to assess botanical composition, structure, quantity and quality of temperate grasslands. Grass Forage Sci. doi: 10.1111/gfs.12312.
- Abbas et al. (2020). Approaches of Satellite Remote Sensing for the Assessment of Above-Ground Biomass across Tropical Forests: Pan-tropical to National Scales. Remote Sens. doi: 10.3390/rs12203351.
- Wang et al. (2019). Remote sensing of terrestrial plant biodiversity. Remote Sens. doi: 10.1016/j.rse.2019.111218.
- Randin et al. (2020). Monitoring biodiversity in the Anthropocene using remote sensing in species distribution models. Remote Sens. doi: 10.1016/j.rse.2019.111626.
- Reddy (2021). Remote sensing of biodiversity: what to measure and monitor from space to species? Biodivers Conserv. doi: 10.1007/s10531-021-02216-5.
- Mao et al. (2020). Remote Sensing Applications for Monitoring Terrestrial Protected Areas: Progress in the Last Decade. doi: 10.3390/su12125016.
- Stebel et al. (2021). SAMIRA-Satellite Based Monitoring Initiative for Regional Air Quality. Remote Sens. doi: 10.3390/rs13112219.
- Dubovik et al. (2021). Grand Challenges in Satellite Remote Sensing. Remote Sens. doi: 10.3389/frsen.2021.619818.
- Kyere, Astor, Graß, Wachendorf (2019). Multi-Temporal Agricultural Land-Cover Mapping Using Single-Year and Multi-Year Models Based on Landsat Imagery and IACS Data. Agronomy Journal 9, 309. doi: 10.3390/agronomy9060309.
Kyere, Astor, Graß, Wachendorf (2020). Agricultural crop discrimination in a heterogeneous low-mountain range region based on multi-temporal and multi-sensor satellite data. Computers and Electronics in Agriculture 179, 105864. doi: 10.1016/j.compag.2020.105864.
Kyere, Astor, Graß, Wachendorf (2021). Spatio-temporal analysis of the effects of biogas production on agricultural lands. Land Use Policy 102, 105240. doi: 10.1016/j.landusepol.2020.105240. - Helka et al. (2020). Combining Environmental Footprint Models, Remote Sensing Data, and Certification Data towards an Integrated Sustainability Risk Analysis for Certification in the Case of Palm Oil. Sustainability . doi: 10.3390/su12198273.
- the IPBES website for data on biodiversity loss and measures to halt it. Available at: https://ipbes.net.