")
")

Bioplastics I Chemicals I Construction I Paper and paperboard I Pharmaceuticals I Textiles I Wood-based products
Using biomass to make things is certainly nothing new - applications like wood for construction or plants and animal furs for clothing go back to the origins of mankind. It is the new and innovative applications that have us excited about the opportunities of the bioeconomy. This means not only using tree logs for building homes, but also mass timber products (like cross-laminated timber) to build scyscrapers [1]. It implies not only using cotton for fabric, but also manmade cellulosic fibers derived from tree pulp to potentially lower the footprint of fashion [2]. Industrial applications in e.g. the chemical industry and through the application of cutting edge technologies (from the use of mircrobes to nanotech) are further opening new market opportunities for the material use of biomass. These range from “drop-ins” (which can replace alternatives - like fossils - using the same value chain; an example is Bio-PE [3]) to completely novel products, sometimes serving new functions [4].
The broad array, scope and innovative nature of bio-based products in traditional, emerging and new sectors can make monitoring a challenge, especially as regards evaluating sustainability. That is because it requires assessing impacts across multiple scales (requiring a bundle of tools), and in the dynamic context of how innovations are used and for what purpose. Looking for example at biodegradable bioplastics, the question is, in what cases do they make sense (e.g. in agriculture) [5] and when does the innovation serve to perpetuate a “throw-away” culture? Monitoring is needed to reveal the trends, in order to help better understand the incentive structures for promoting a smart use of biomass across multiple sectors of the modern bioeconomy.
This website breaks down different use categories to include illustrative examples. It presents data on the German, EU and global levels, depending on data availability and to depict significant trends. Seven main categories are distinguished (in alphabetical order and noting that there is overlap between them):
Bioplastics I Chemicals I Construction I Paper and paperboard I Pharmaceuticals I Textiles I Wood-based products
Bioplastics
More than 400 Million tonnes of plastic are produced annually at a global scale [6]. Production is expected to triple by 2060—at which time only 12% of plastics are projected to stem from recycling. Breaking the plastic wave, and especially ending plastic pollution, is one of the big environmental challenges of the 21st century [6]. The question is whether, how and to what extent bioplastics can be part of the solution.
Bioplastics currently comprise less than 1% of the plastics market [7]. In 2021 around 2.3 Million tonnes of bioplastics were produced globally. This is expected to nearly triple in the next 6 years. The highest share of bioplastics are produced in Asia [8]. A little more than a quarter of bioplastics were produced in Europe in 2021 [9]. In total it is estimated that around 1 million hectares of agricultural land were needed to grow the biomass used as a feedstock for bioplastics in 2021, or around 0.02% of global agricultural land [10].
The majority of bioplastics are used for packaging (comprising 52% of the total bioplastics market in 2021). A diverse and continuously expanding range of further applications can be found in e.g. the textiles, consumer goods, agriculture, automotive and transport, electrical and building market segments [11]. Further examples are depicted in “The Biopolymer Database” [12] and the “Bioplastics Calculation Tool” [13]. To assist business, especially for packaging and food manufacturers, a checklist as a decision-making aid is also available online (“The Bioplastics Tool” [14]), including an evaluation of different materials and practical examples.
Overall, sustainability depends on both the application and scale of use. The current mass of plastic used on our planet cannot be “greened” by shifting to biomass-based resources (there is simply not enough land). A more efficient use of plastics and increased recycling of plastic waste, including the use of CO2 from incineration, are an absolute must.
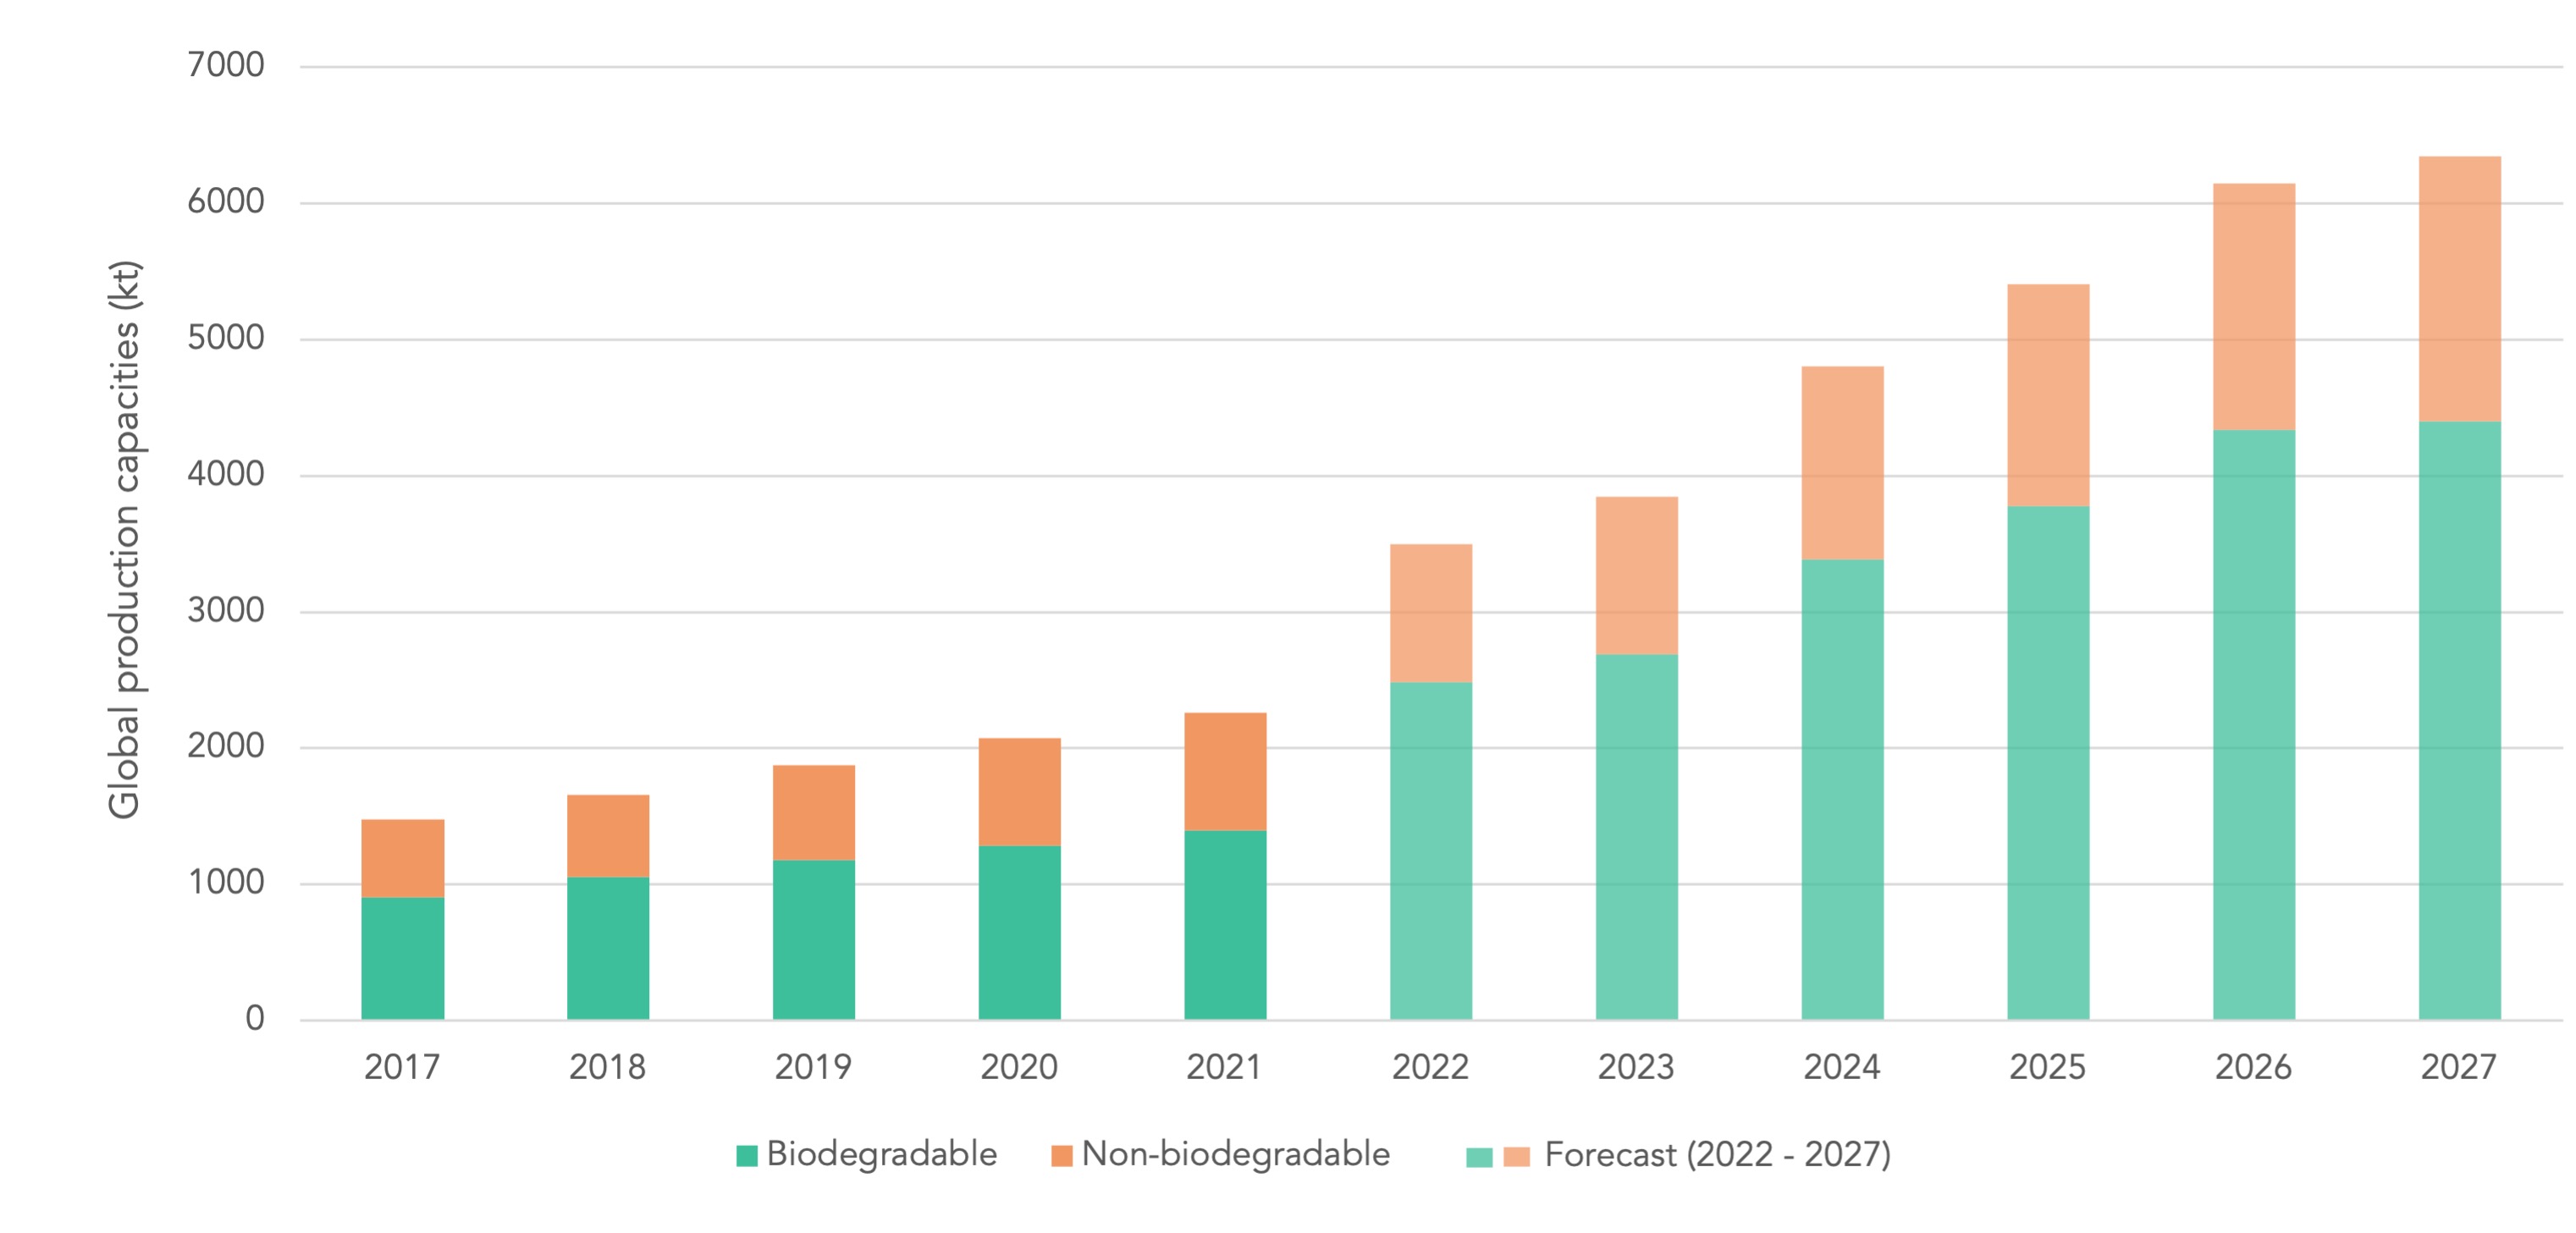
Global production capacities of bioplastics broken down into biodegradable [15] and non-biodegradable [16] shares. (Source: Based on data given in the Bioplastics calculation tool operated by the Institute for Bioplastics and Biocomposites of the Hochschule Hannover [7]).
Chemicals
The chemical industry used an estimated 562 million tonnes of feedstocks (predominately fossil-based) to create a whole range of materials in the EU-28 (2018) [17]. The share stemming from biomass-based resources is currently small (estimated as 8%, mostly for biofuels and agrochemicals) [18]. That said, forecasts expect increases in the demands for bio-based feedstocks for the chemical sector in the future (e.g. at rates nearly 3 times higher than the growth expected in petrochemicals) [17]. Sustainability concerns relate to specific feedstocks from hotspots (like palm oil used in detergents), as well as the competition with food due to limited agricultural land.
The bio-based chemical sector produces a multitude of further substances, many of which are used as intermediaries for various purposes. These bio-based chemicals are reported in product groups according to their function (use in end-products or as a step in-between):
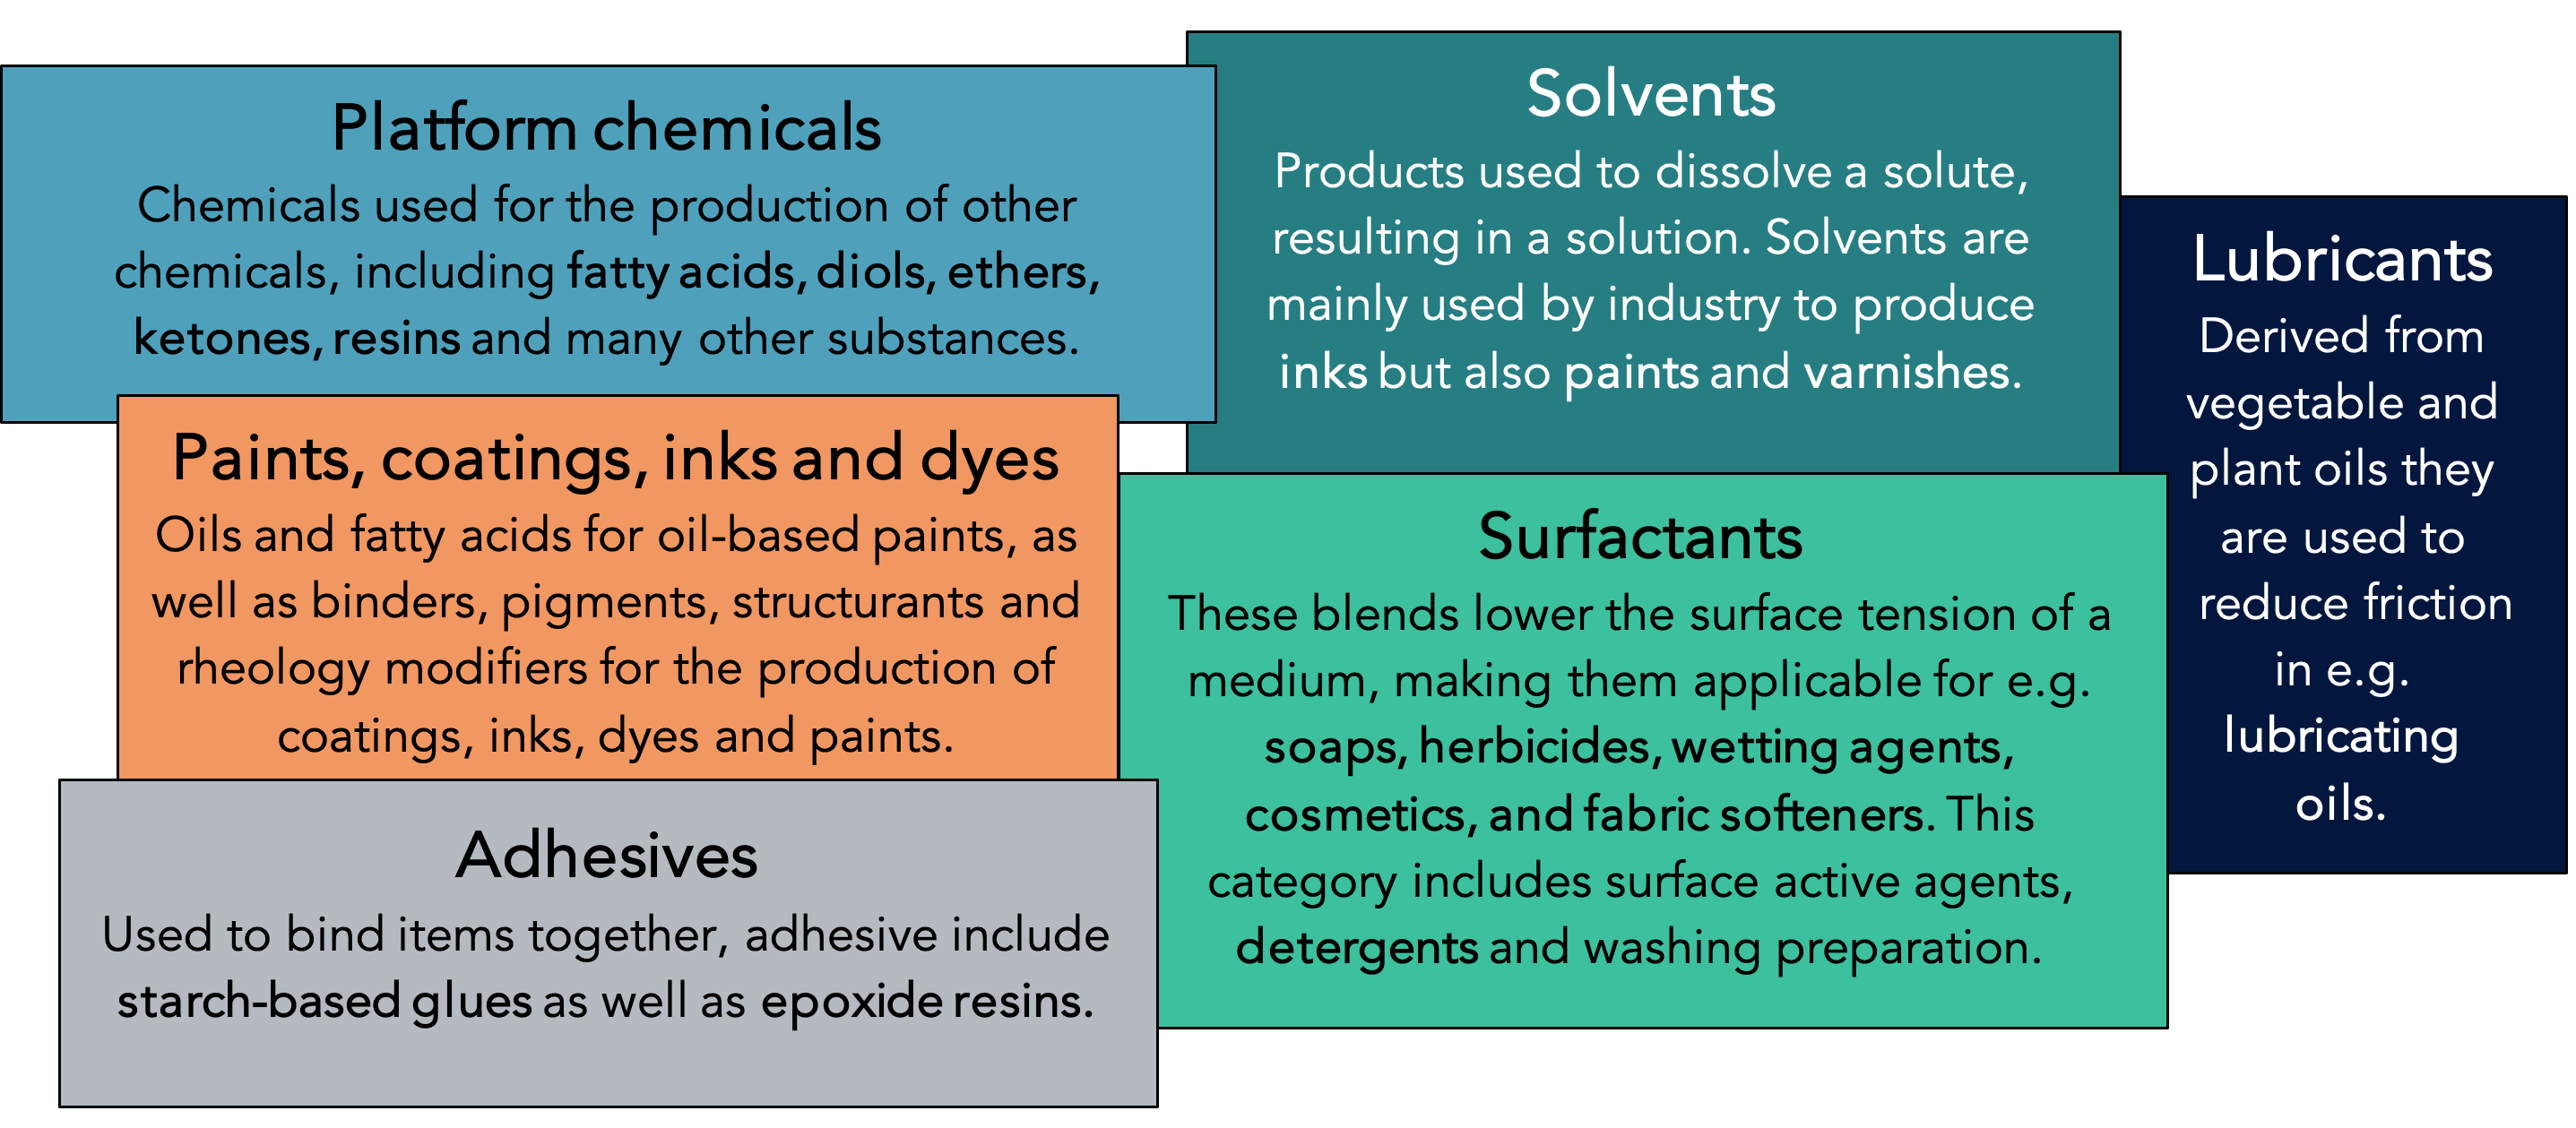
Illustrative breakdown of biochemical product applications and use categories (Source: Illustration by Beck-O’Brien. For more information on 15 product application categories for monitoring bio-based chemical markets see Leeuwen et al. (2022) [17]).
Biorefineries are used to process biomass into bio-based chemicals. Monitoring and mapping of biorefinery plants shows a concentration of plants in Germany [19]. According to data on the Platform “Chemical and material biorefineries in the EU” Germany has the second highest number of biorefineries (59) behind France. The majority rely on primary sources of biomass (78%), mostly from agriculture, whereas 22% rely on secondary sources (like waste) [20].
Leuna, Germany is the location of a new biorefinery (currently under construction) planned to produce “next-generation” biochemicals by UPM [21]. It plans to use hardwood (mainly beech) sourced in the region to produce two main products. First, Monoethylene Glycol, which is further used as a base material for a range of products (PET bottles, packaging materials, textiles, engine and battery coolants, cleaning agents, fragrances, etc.). Second, lignin-based functional fillers, which are a completely new product with end-uses in various rubber products (tires, hoses, flooring). Technical start-up is planned for the end of 2023 with an estimated 550 Million Euro invested [21].
Construction
The global construction sector is the largest consumer of raw materials (comprising 85% of all mining and quarrying activities [22]). Global cement production is the third-largest source of anthropogenic emissions of carbon dioxide (behind fossil fuels and land-use change) [23]. For that reason, many see building with biomass-based resources, especially wood, as a key strategy to merge environmental, social and economic goals. However, also wood is a limited resource.
Building with wood enables resource-efficient construction and opens possibilities for prefabrication and modular design (reducing waste, providing greater flexibility and enabling later re-use). It may also be a strategy to turn the built environment into a carbon sink, offering the double benefit of replacing carbon-intensive building materials (like cement) [24] and storing carbon in long-lived wooden structures [25]. However, this potential is critically dependent on both the management of forests (toward climate-resilient and ecologically valuable forest stands) and sourcing of timber at levels which can be supplied in a sustainable way. Indications already point to a larger wood consumption footprint than supply capacity in Germany [26].
In Germany, more than 21% of residential buildings approved for construction are made (at least partly) of wood [27]. The trend has been increasing continuously, with the highest shares in Southern Germany (Baden Württemberg and Bayern have shares of 34% and 26% compared to e.g. 11% in Niedersachsen of approved wooden building permits in total residential permits) [27]. Around 64% of the wood used in construction was used for renovation and 36% for new construction in 2012 [28]. An examination of the future potential for building with wood in Germany came to inconclusive results (it is dependent on multiple variables, including competition with wood for energy), but did find that “an increase in the timber construction quota without imports but only with an increase in the domestic forestry area is estimated to be unrealistic” [29].
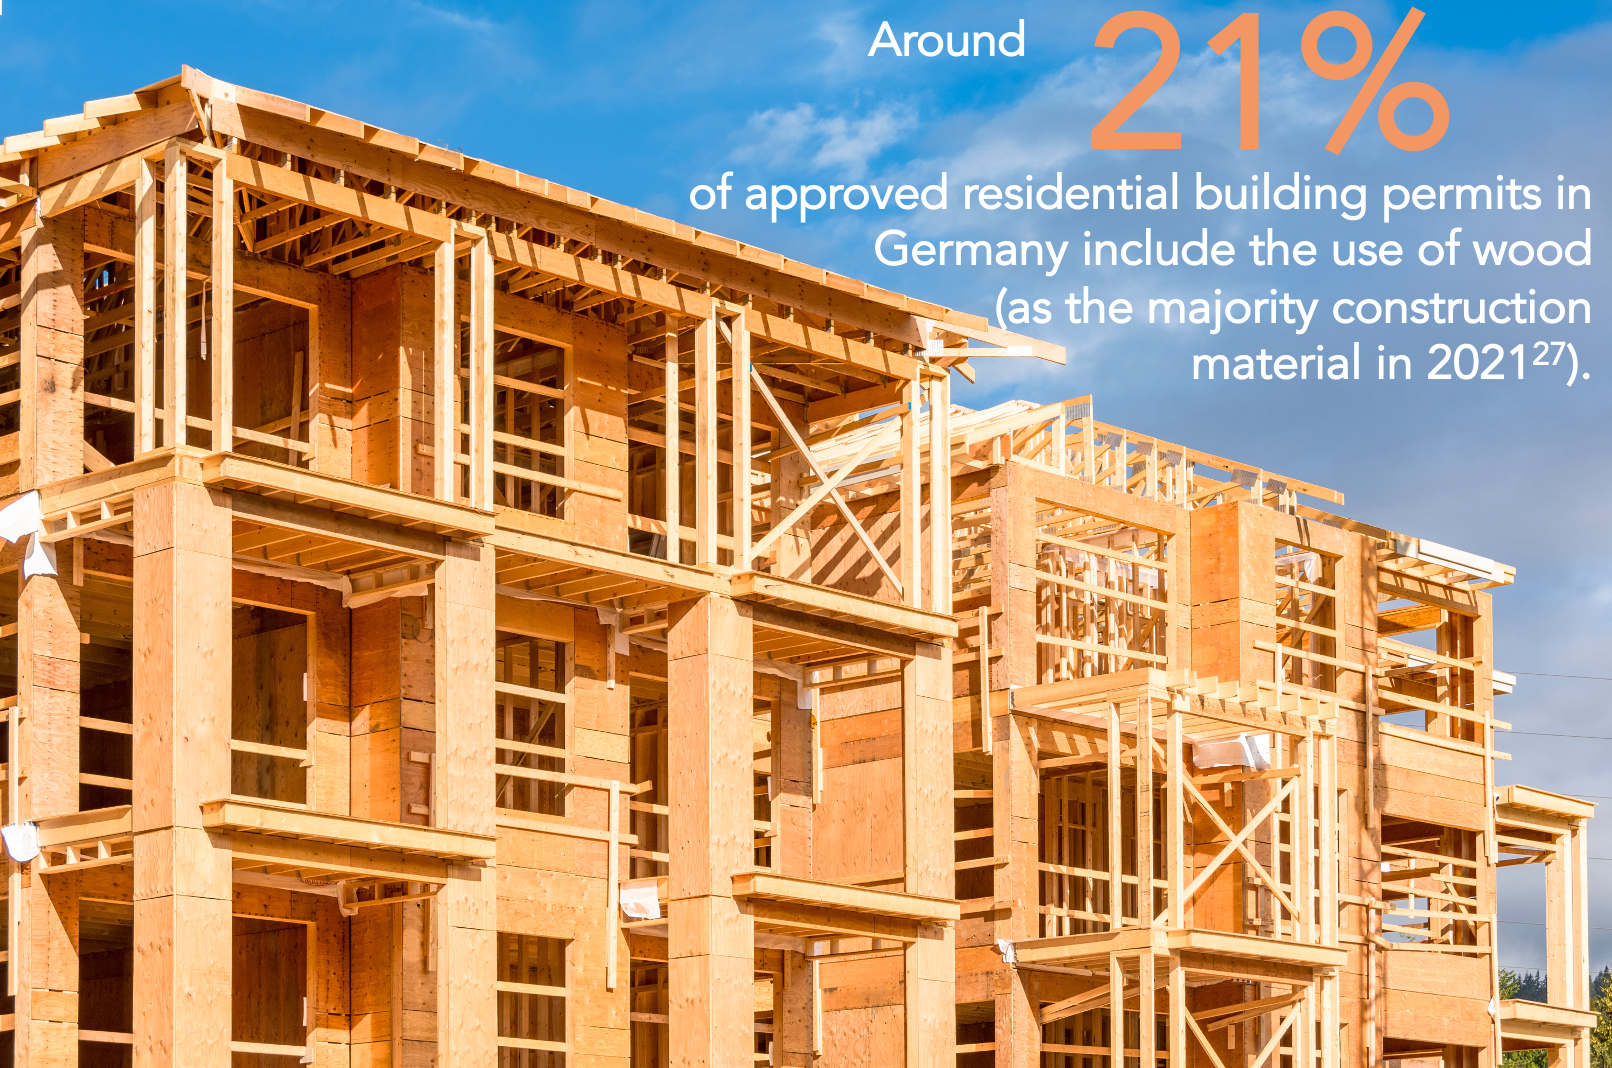
© Background image: Imagenet | Adobe Stock
Engineered wood products are also changing the face of construction. The Alpine region of Europe (Germany, Austria, Switzerland, Czechia and Italy) are the largest global producers of cross-laminated timber (producing more than half of global supply in 2020) [30], and the sector is expected to grow substantially [31]. Insulation is another application for wood-based fibers that is continuing to grow. Wood fibers comprised around 3.5% of insulation materials in Germany in 2011 and around 5% in 2019 [32].
Paper and paperboard
Germany has one of the highest rates of per capita paper consumption in the world, consuming 228 kg per person in 2021 [33]. This is higher than the EU average (180 kg) and more than 4-times the global average (55 kg) [34]. On the one hand, digitalization has led to a decrease in printing paper, but especially e-commerce, has increased packaging demands.
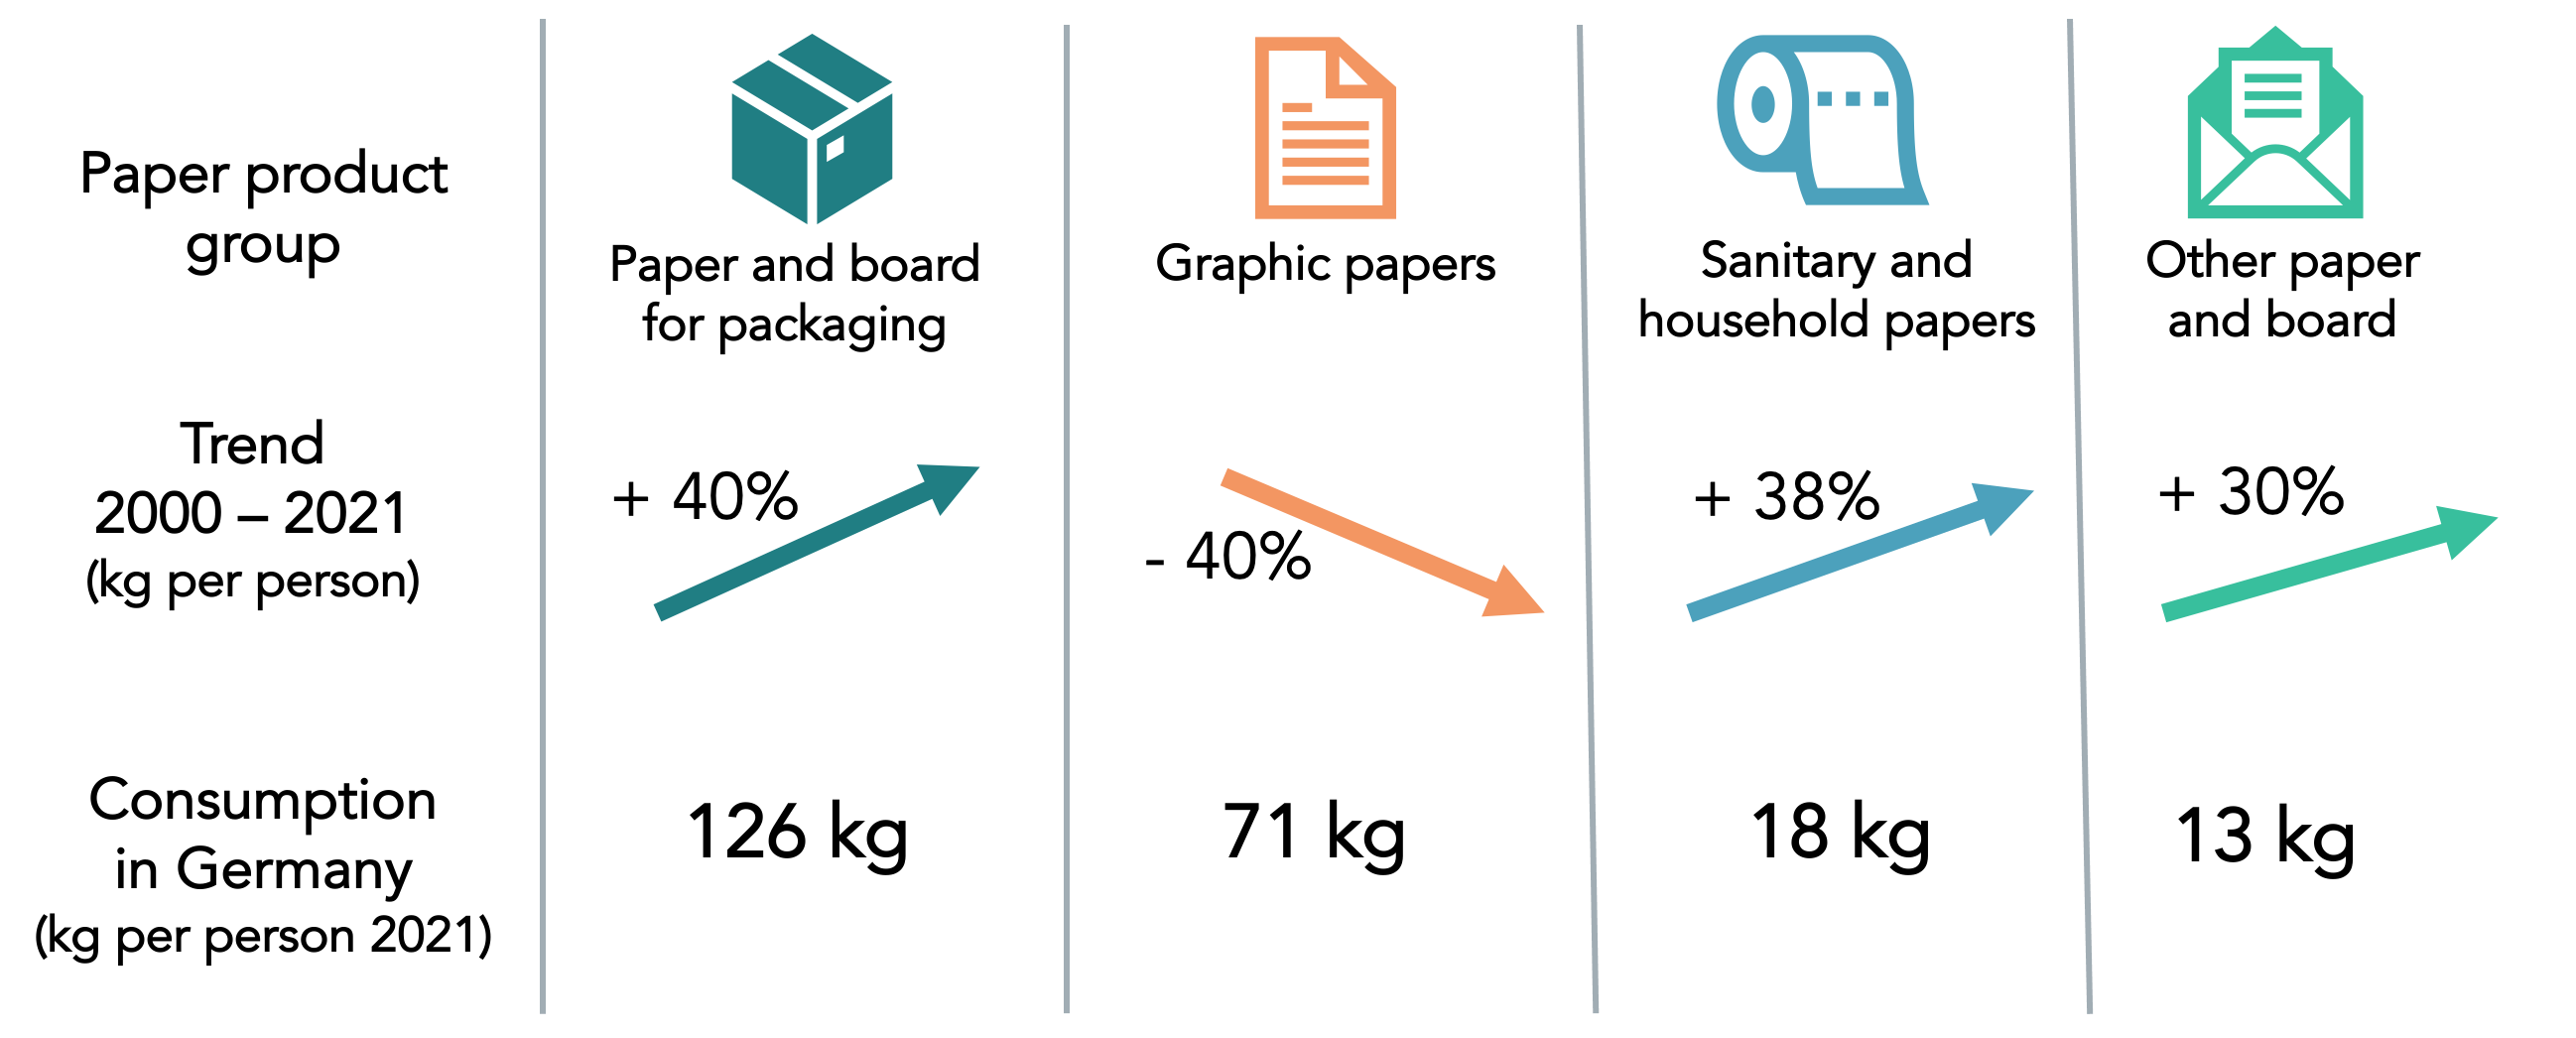
Paper and paperboard consumption trends in Germany, per capita 2000 – 2021. (Source: Based on data from DIE PAPIERINDUSTRIE-Leistungsbericht PAPIER 2022 [33]and presentation from NABU [34]).
The level of paper recycling in Germany has increased substantially. In 1990 the share of waste paper in total paper and paperboard production was 49%. In 2020 this ratio reached 79% [35]. Although it is technically possible to increase recycling rates, the potential to move beyond Germany’s high level of paper recycling is limited. This is due both to the decrease of printing and writing paper (making “used paper” a scarce resource) and also impurities, in particular from imported paper (as regards printing inks, adhesives and paper additives) [35].
Germany is the fourth largest producer of paper and paperboard in the world, and the largest producer in Europe. The industry produced 23 million tonnes of paper and paperboard in 2021, relating to a turnover of 15.5 billion euros and employing nearly 40,000 people (comprising less than 1% of total turnover and employment in Germany’s manufacturing sector in 2021) [33]. It is an energy-intensive sector (accounting for just over 6% of primary energy demand of total manufacturing sectors in 2019) [36]. Germany imports large quantities of pulp: nearly one-third of chemical pulp imports are from Brazil, followed by Finland (16%) and Sweden (15%). For the pulp produced within Germany, more than 9 million cubic meters of wood (solid, under bark) were needed in 2021 (60% stemmed from roundwood and 40% from sawmill by-products) [33].
Global paper and paperboard consumption is expected to more than double between 2020 and 2050 (from 401 million tonnes [37] to 878 million tonnes [38]). Most of this growth is expected in developing countries, as people raise their standard of living. Already around 40% of industrially harvested wood worldwide is used for paper production [39]. Increased demands will raise pressures on forests and on land for pulpwood plantation expansion, and already: “Indigenous peoples continue to struggle to have their rights respected in all pulpwood-producing regions” [39]. While both Germany’s production mills (operating at high levels of efficiency) and recycling rates represent best practices on the global stage, its consumption levels are too high. Reducing paper consumption in Germany would relieve environmental pressures (on forests, for energy and on the climate) and help make room for a more fair distribution of paper products. There are multiple levers, addressing not only private consumption but also e.g. packaging for transporting goods across Germany to wholesalers and retailers [40].
Pharmaceuticals
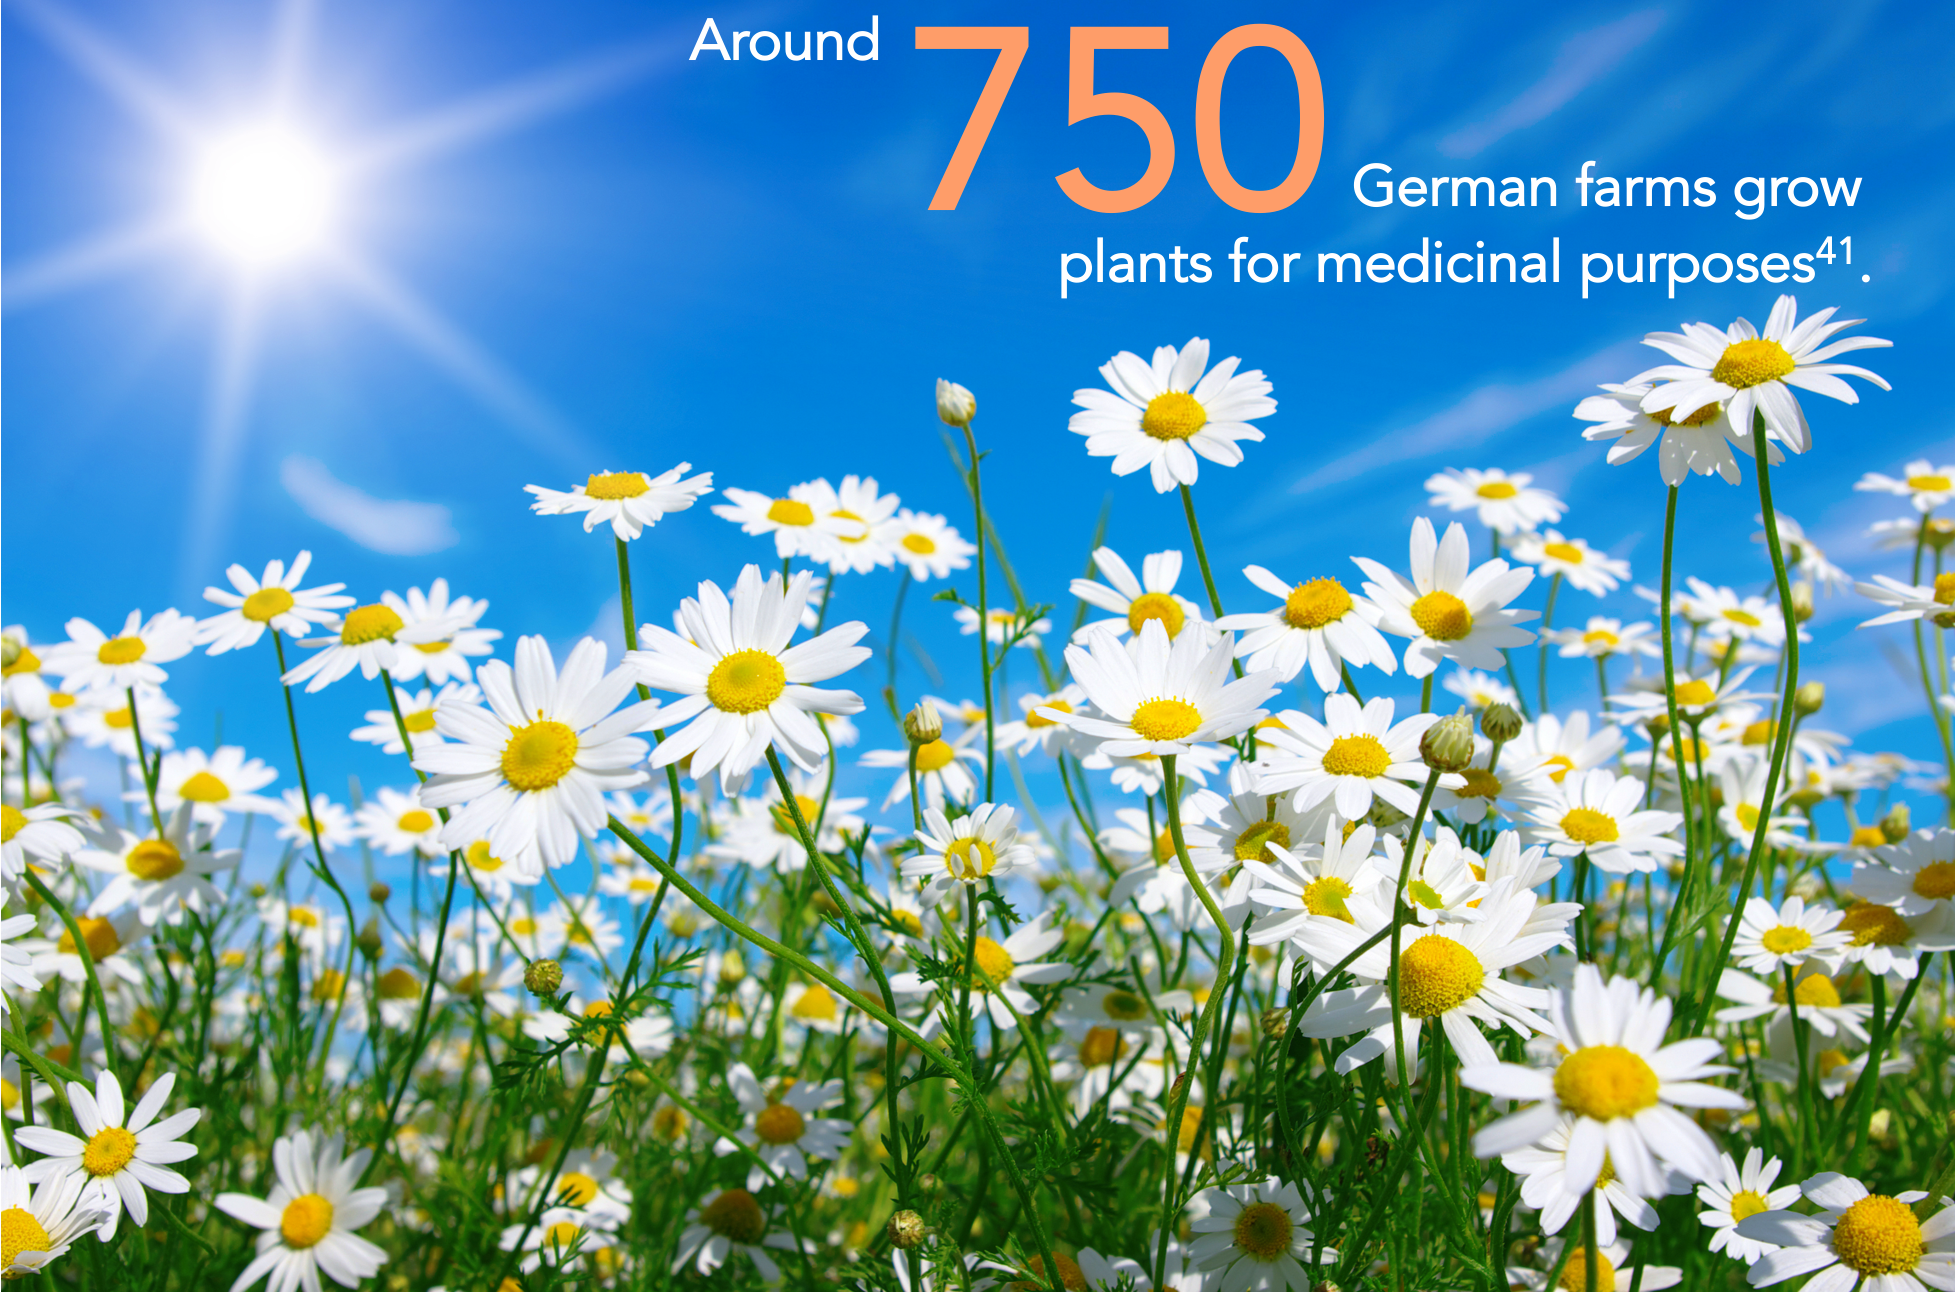
Medicinal plant species are estimated to cover around 12 thousand hectares in Germany [41]. This area comprises around 750 farms and 120 different medicinal plant species. The most prevalent are chamomile, flax, milk thistle, peppermint, sea buckthorn, fennel, St. John's wort and woolly foxglove. Of the total turnover of medicines sold in pharmacies in 2011, 97% were based on synthetic pharmaceuticals and 3% on herbal pharmaceuticals [42].
© Background image: Alekss | Adobe Stock
Textiles
Global fiber production almost doubled in two decades – from 58 million tonnes in 2000 to 113 million tonnes in 2021 [43]. Under business-as-usual trends, it is expected to increase by another third by 2030 (to 149 million tonnes). The average level of fiber production per person has also increased significantly – from 8.5 kg in 1980 to 14 kg in 2020, and it is likely to continue to grow. According to the Textile Exchange: “The growth in fiber production has significant impacts on people and the planet… Without rethinking growth, the industry will not stay within the 1.5° pathway” [43].
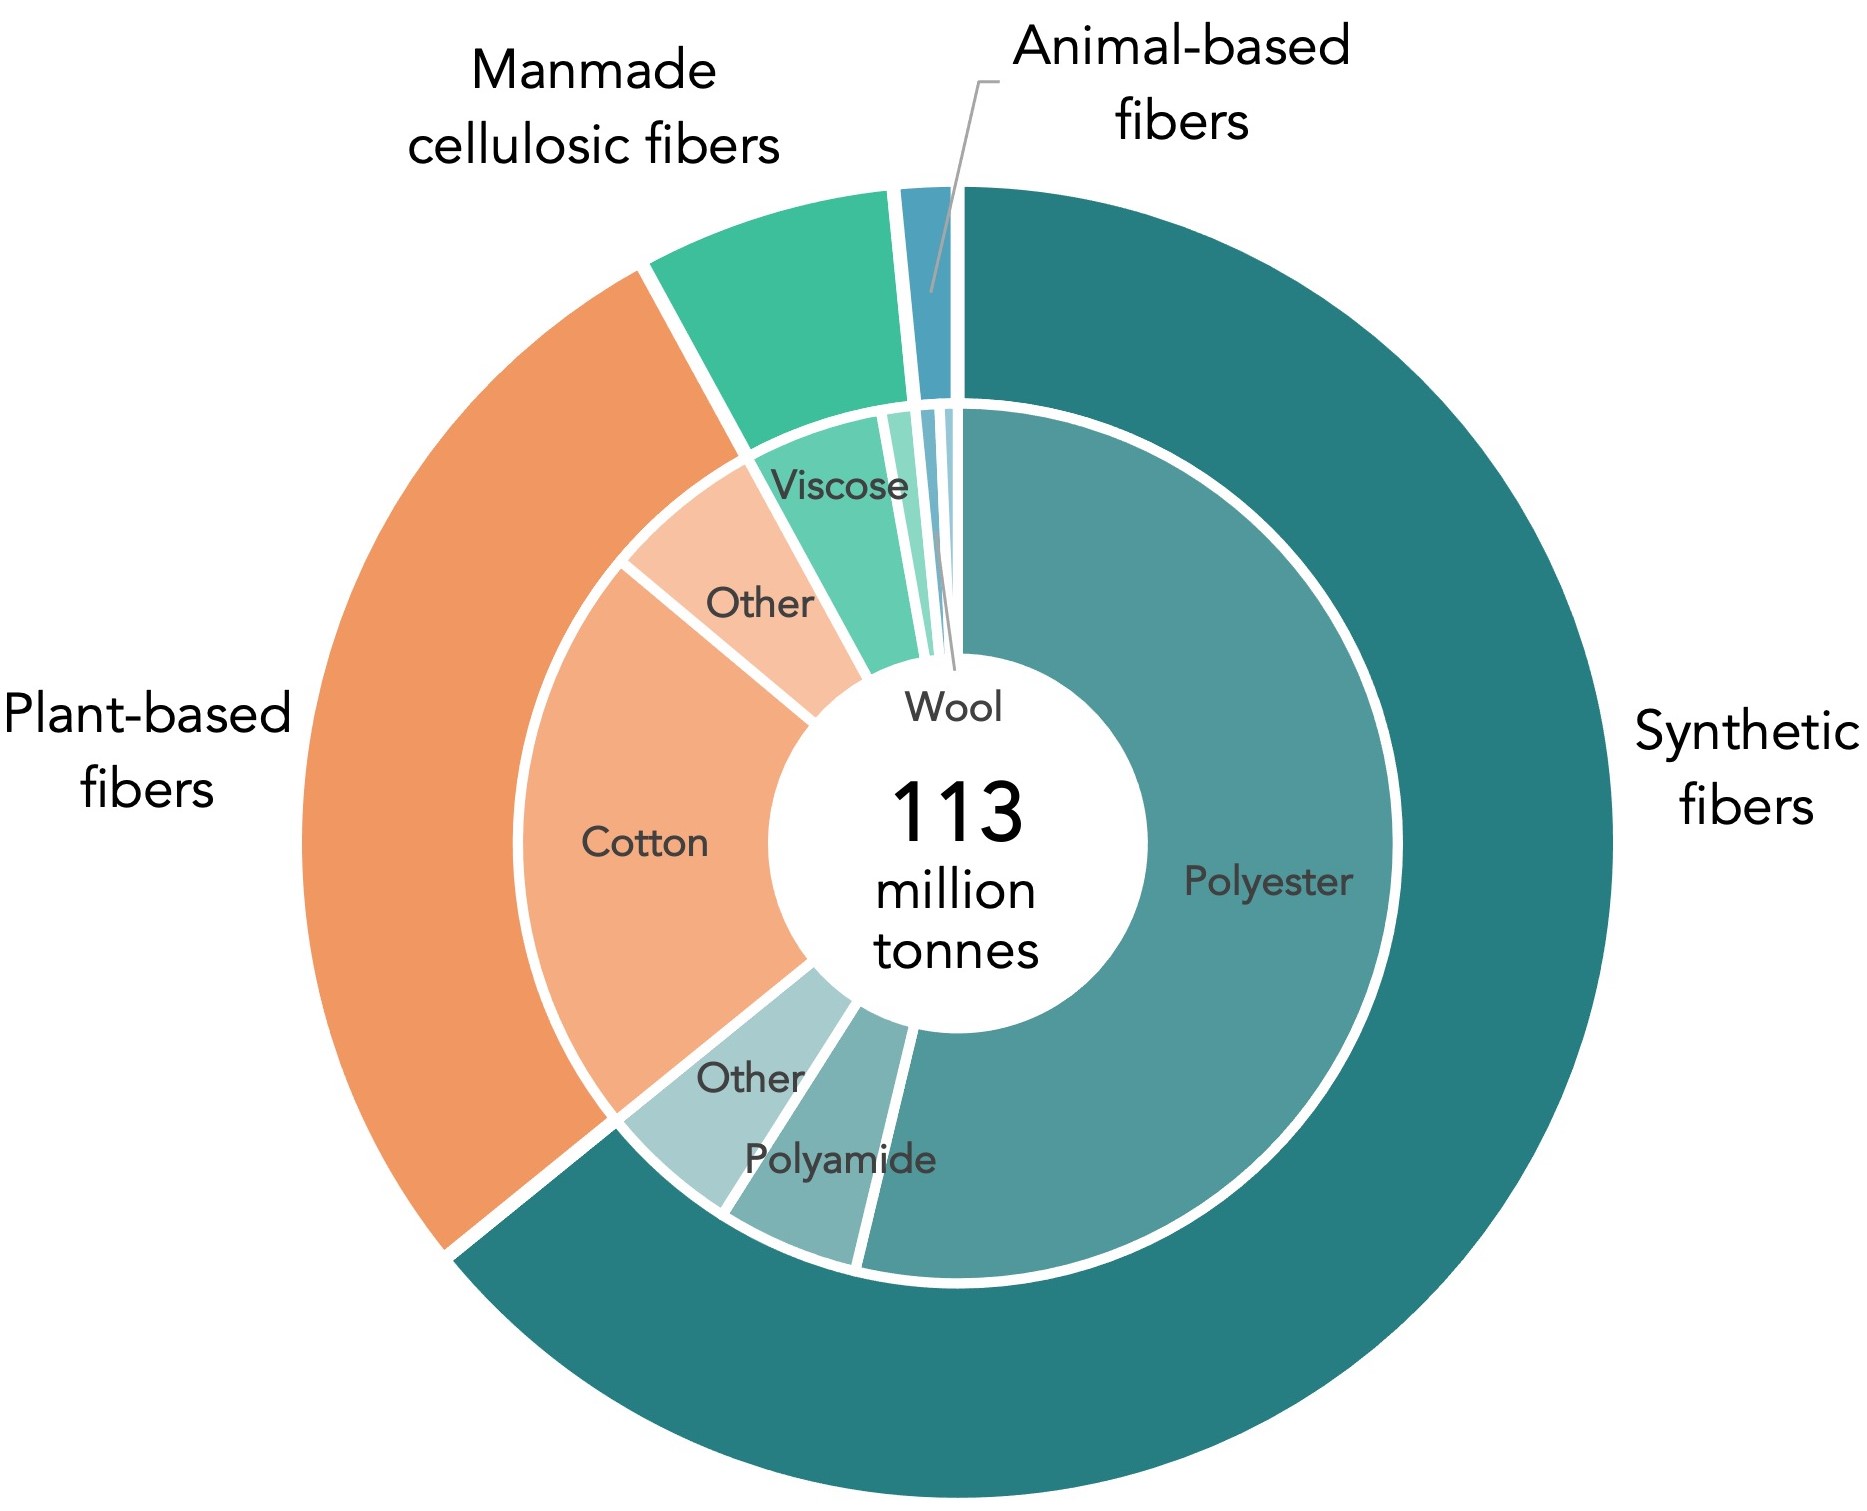
Global fiber production in 2021 (in million tonnes). (Source: Textile Exchange (2022) [43]).
Synthetic fibers comprise the majority of global fiber production (64% in 2021). Polyester is by far the most common [43]. As fossil-based fibers, this group is CO2-intensive to produce and associated with environmental concerns, related to e.g. pollution of microfibers in the ocean [44]. Recycling is a key strategy to improve environmental performance, and currently nearly 15% of polyester stems from recycled PET plastic bottles. Biobased polyester (made from e.g. corn, sugarcane and other plant-based fibers) comprised around 0.02% of the market share in 2021 [43].
Cotton is the second largest fiber produced globally (comprising 22% of production in 2021). Around 24% of cotton is produced within the requirements of a “preferred cotton” programme (with varying degrees of sustainability) and around 1% is based on recycled cotton fibes [43]. Cotton production is constrained by land and in particular water [44]. Average yields have plateaued since 2014 and climate change may impact future potentials. It has been estimated that by 2040, “half of global cotton growing regions will face high or very high climate risk exposure to at least one climate hazard” [45].
Manmade cellulosic fibers comprised around 6% of global fiber production in 2021 and have grown rapidly [43]. These fibers are overwhelmingly made of wood. Fibers such as viscose and lyocell are made from dissolving wood pulp, which is a chemical pulping process used mostly in pulp mills in China [46]. These wood-based fibers are often promoted as environmentally favorable alternatives to cotton and synthetic fibers, and for that reason, their growth is expected to continue to grow at rates above the market average (e.g. 4 - 6 % until 2030 compared to the market average of 2 – 3%) [44]. However, the sustainable supply potential from global forests is limited [26], and building this potential in a way that does not overburden forest ecosystems is highly connected to factors that impact pulp demand overall (like paper consumption levels) [46].
Animal fibers comprised around 2% of global fiber production in 2021. This is comprised mostly of wool, which has been declining in production volume over the decades [43]. Around 1.4 billion animals were used for leather production in 2021. Cattle hides account for around two-thirds of leather production and most of that production occurs in China (16%), the US (13%), Brazil (12%) and Argentina (6%) [43]. A critical environmental concern is deforestation tied to both cattle ranching and soy production for animal feed [47], especially in the Brazilian amazon (and exported abroad). There are implications for monitoring. For example, accounting for animal hides as by-products of meat and dairy production processes in supply chain management and certification systems may hide the role that leather plays in deforestation [48] (depending on the level of demand) and is illustrative of why a systemic perspective is needed to support monitoring of the bioeconomy, its resource base and its impacts.
Wood-based products
© Kaninstudio, Anatoliy Sadovsk, sergey0506 | AdobeStock
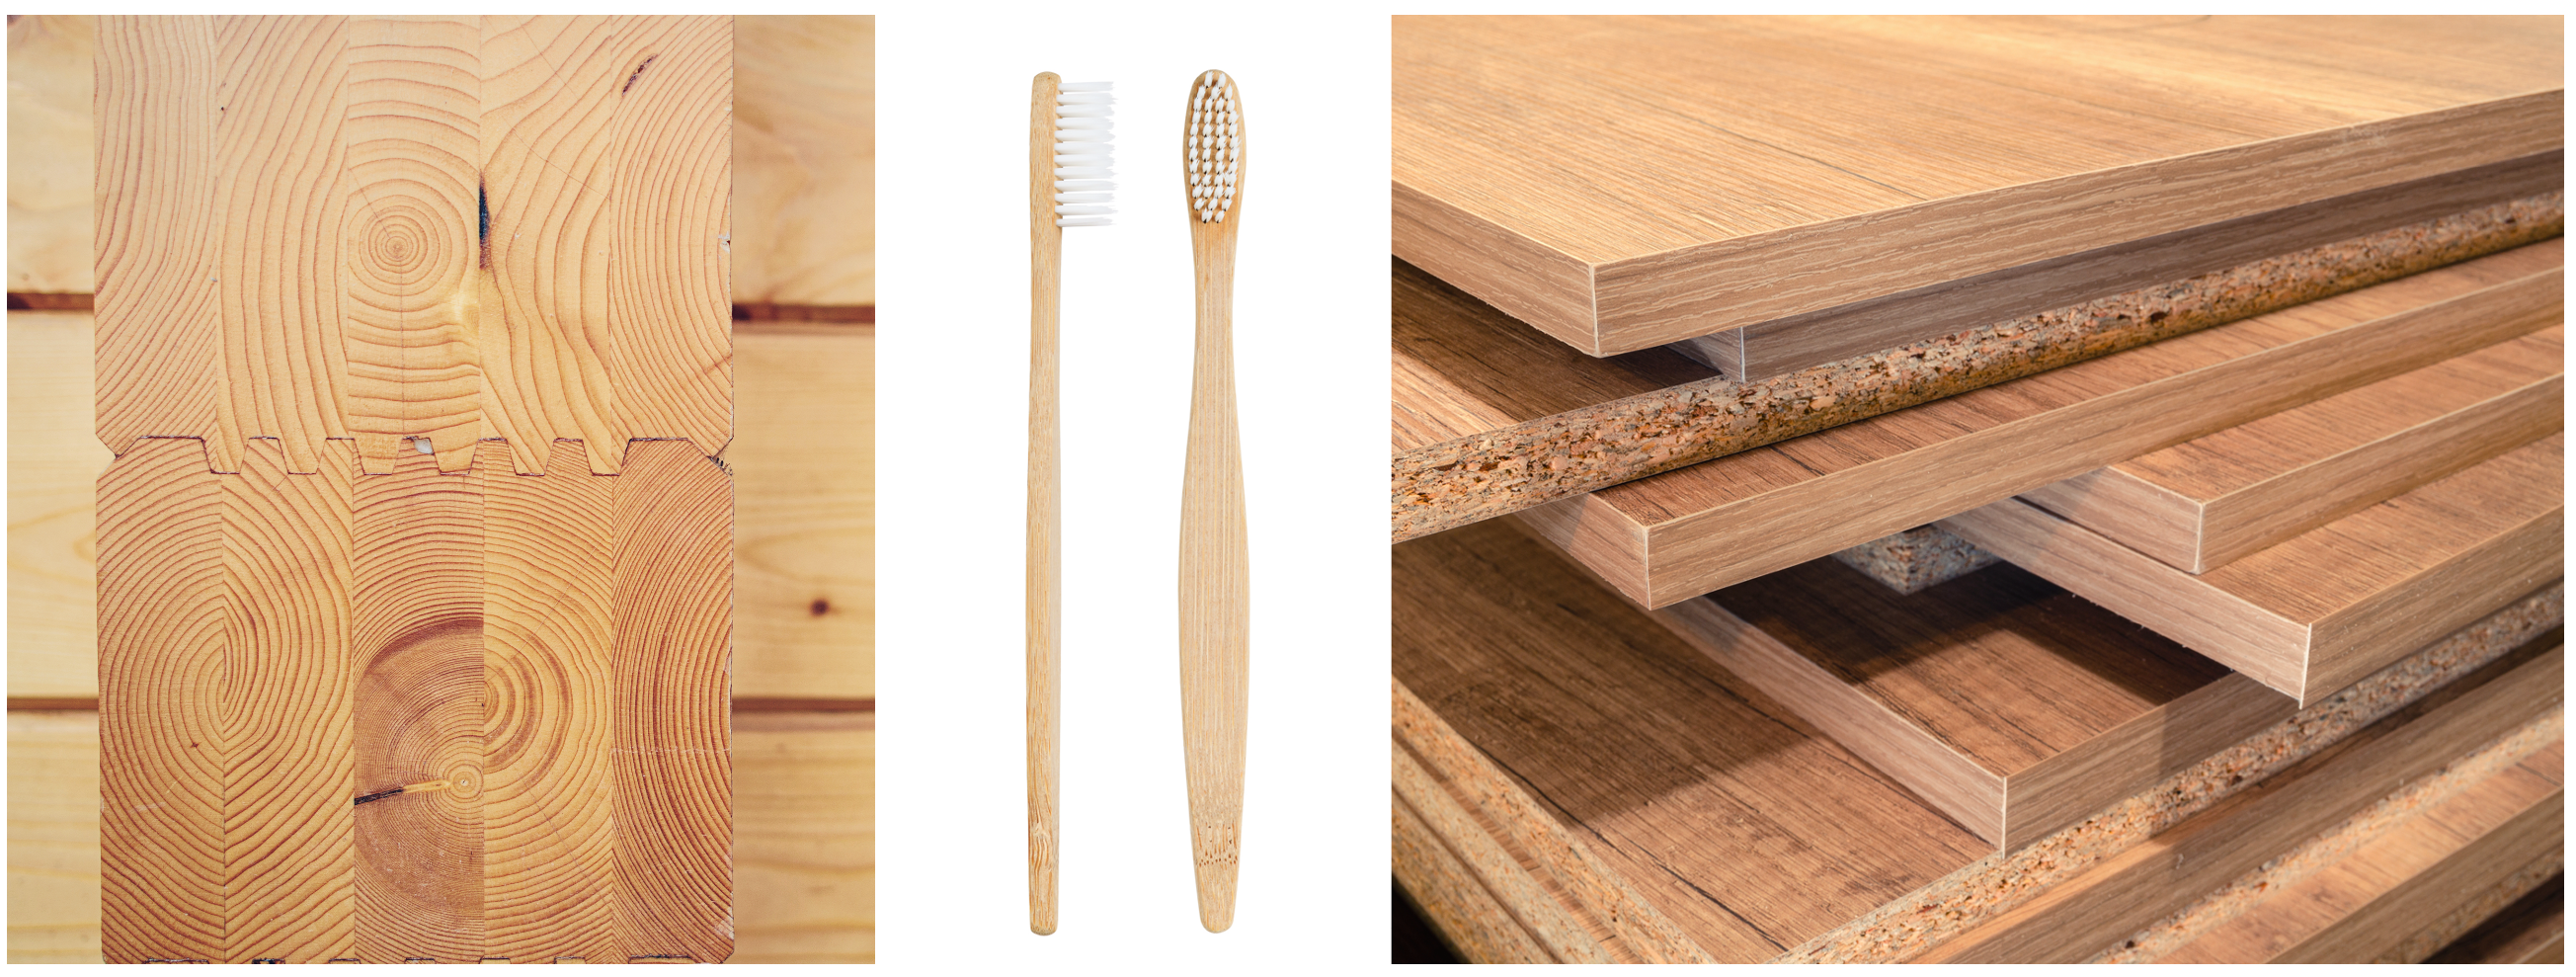
From self-cleaning toothbrushes to the production of high-tech materials, innovative wood-products have the technical potential to reach a multitude of markets [49], on top of existing uses. For example, furniture remains a relevant end-use of sawn wood and wood-based panels. In 2018 the value of world furniture traded internationally was estimated to be 150 billion USD, comprising 30% of global furniture production and signaling a migration of furniture production to lower-cost regions [50].
Innovative products that are already produced at an industrial scale include e.g. cross-laminated timber, wood-based composites, and lyocell [51]. Potentially new products that will likely reach markets soon include wood foam, lignin-based adhesives, glycols, and bioplastics [51]. Wood foam, for example, is a lightweight rigid foam that could be used for insulation or packaging. It won the GreenTec award in the Construction and Living category in 2015 [52].
At a global scale, the consumption of primary processed wood products is expected to grow by 37% by 2050 (compared to 2020). An additional demand for innovative wood products (mass timber and man-made cellulose fiber) would add an additional 8% of growth by 2050 [53]. The potential for Germany to build its bioeconomy -- based on domestic and global timber resources – should be monitored in the context of global trends and limits [26].
Notes and references
- See, for example, the Tall Wood Building Demonstration Initiative (2021) launched by Natural Resources Canada, https://ostrnrcan-dostrncan.canada.ca/handle/1845/246503. Accessed June 2024.
- Examples include Viscose, Lyocell and modal (see also https://textileexchange.org/manmade-cellulosics/). In some cases they may provide benefits regarding environmental performance, e.g. in cases where water and land shortages may impact cotton or when mineral oil-based fibers lead to microparticle pollution. That said, e.g. viscose is also dependent on a chemical and energy-intensive process. See the textiles section.
- This is polyethylene (PE) made from biomass and has the same chemical structure as mineral oil-based PE. It can be used for example as food packaging. See the “Biokunststofftool” for more information; https://biokunststofftool.de/materials/bio-pe/?lang=en#1549380148492-8a0fdf8c-09e3. Accessed Feb, 2023.
- The wide range of applications can be explored in multiple data bases. FNR has compiled a lists of databases for bio-based products focused especially in bioplastics; https://biowerkstoffe.fnr.de/biokunststoffe/datenbanken/. Accessed Feb, 2023.
- Bauchmueller et al. (2021). BioSinn: Products for which biodegradation makes sense. Nova-Institut.
- See the Global Plastics Outlook by the OECD, with the second report released in 2022; https://www.oecd.org/environment/plastics/. Accessed Feb, 2023.
- Explore the data online in the bioplastics calculation tool developed in Germany; https://biopolydat.ifbb-hannover.de/home. Accessed Feb, 2023.
- Comprising nearly 50% of global bioplastic production in 2021 and expected to increase to cover more than two-thirds of global bioplastic production in 2026; https://biopolydat.ifbb-hannover.de/market-data. Accessed Feb, 2023.
- Expected to decrease to less than 20% by 2026; https://biopolydat.ifbb-hannover.de/market-data. Accessed Feb, 2023.
- Based on data compiled by the Institute for Bioplastics and Biocomposites, Hochschule Hannover, and available online; https://biopolydat.ifbb-hannover.de/market-data. Accessed Feb, 2023.
- More detailed information on e.g. the breakdown on the types of bioplastics is available at the Bioplastics calculation tool; https://biopolydat.ifbb-hannover.de/market-data. Accessed Feb, 2023.
- The Biopolymer Database offers comprehensive material data about biopolymers, their applications and a multitude of related aspects. It shows examples! https://biopolymer.materialdatacenter.com/bo/main. Accessed Feb, 2023.
- The Bioplastics calculation tool, operated by Institute for Bioplastics and Biocomposites of the Hochschule Hannover, comprises information on process routes and requirements, market data on production capacities and sustainability assessments; https://biopolydat.ifbb-hannover.de/home. Accessed Feb, 2023.
- The tool was developed by the Association of Organic Food Manufacturers as part of the project “Options for action for the use of sustainable bio-based plastics as packaging for food” funded by the Federal Ministry of Food and Agriculture (BMEL); https://biokunststofftool.de. Accessed Feb, 2023.
- Examples of biodegradable bioplastics include Polyhydroxyalkanoates (PHA), polylactic acid (PLA), polybutylene adipate terephthalate (PBAT), polybutylene succinate (PBS), biodegradable starch blends, other biodegradable bioplastics (cellulose derivatives/cellulose regenerate, PCL etc.); https://biopolydat.ifbb-hannover.de/market-data. Accessed Feb, 2023.
- Examples of non-biodegradable bioplastics include: Bio-polyamides (PA), bio-polypropylene (bio-PP), bio-polyethylene (bio-PE), bio-polyethylene terephthalate (bio-PET), polytrimethylene terephthalate (bio-PTT), polyethylene furanoate (PEF), other non-biodegradable bioplastics (bio-TPE, bio-PC, bio-PVC, bio-PUR etc.); https://biopolydat.ifbb-hannover.de/market-data. Accessed Feb, 2023.
- van Leeuwen et al. (2022). Future market outlooks for new bio- based products. BIOMONITOR Project. Deliverable 5.2 Grant N. 773297. Available at: http://biomonitor.eu/wp-content/uploads/2022/10/BioMonitor_D5.2_FutureMarkets_28Sep22-.pdf. See also the paper: Sturm et al. (2023). Providing Insights into the Markets for Bio-Based Materials with BioMAT. Sustainability: 15. doi: 10.3390/su15043064.
- Which is significantly higher than previous estimates in the literature. Spekreijse et al. (2019) estimate that the EU produces 4.7 Mt of bio-based chemicals, which is a bio-based share of around 3%. This difference is due to different system boundaries and calculation approaches. See the report (source 17) for more information. Spekreijse et al. (2019). Insights into the European market of bio-based chemicals. Analysis on then key products categories. JRC report. doi: 10.2760/18942
- Chemical and material biorefineries in the EU (available at: https://datam.jrc.ec.europa.eu/datam/mashup/CHEMICAL_BIOREFINERIES_EU/). See also the Global Biorefinery Plant Portal (available at: http://webgis.brindisi.enea.it/bioenergy/maps.php) and Bio-based Industry (available at: https://datam.jrc.ec.europa.eu/datam/mashup/BIOBASED_INDUSTRY/)
- Available at: https://datam.jrc.ec.europa.eu/datam/mashup/CHEMICAL_BIOREFINERIES_EU/ (accessed Feb 2023).
- See the website of UPM for more information: https://www.upmbiochemicals.com/about-upm-biochemicals/biorefinery-leuna/ (accessed Feb. 2023).
- UNEP Global Environmental Alert Systems (GEAS), “Sand, rarer than one thinks,” UNEP, 2014.
- Andrew (2018). Global CO2 emissions from cement production. Earth Syst. Sci. Data 10, doi: 10.5194/essd-10-195-2018.
- The majority of LCAs show a positive substitution effect when comparing functional units. See also: Verkerk et al. (2021). The role of forest products in the global bioeconomy – Enabling substitution by wood-based products and contributing to the Sustainable Development Goals FAO. doi: 10.4060/cb7274en.
- See for example the vision of Bauhaus Erde (https://www.bauhauserde.org) and the overview report by Porteron (2023). Seeing the forest through the trees: How sustainable timber buildings can help fight the climate crisis. ECOS—Environmental Coalition on Standards.
- Beck-O’Brien et al. (2022). Everything from wood – The resource of the future or the next crisis? How footprints, benchmarks and targets can support a balanced bioeconomy transition. WWF Germany.
- Fachagentur Nachwachsende Rohstoffe e.V. (FNR). Holzbauquote. Available online: https://mediathek.fnr.de/holzbauquote.html. Accessed 6 March, 2023.
- Mantau et al. (2013). Holzeinsatz im Bauwesen – Verbindungsstrukturen nach Gebäuden und Gewerken in: Weimar and Jochem (eds): Holzverwendung im Bauwesen – Ein Projekt der „Charta für Holz“. Thünen Report 9.
- Wolf et al. (2020). Potenziale von Bauen mit Holz; Erweiterung der Datengrundlage zur Verfügbarkeit von Holz als Baustoff zum Einsatz im Holzbau sowie vergleichende Ökobilanzierung von Häusern in Massiv-und Holzbauweise. UBA. Available at: https://www.umweltbundesamt.de/publikationen/potenziale-von-bauen-holz.
- UN (2021). United Nations and the Food and Agriculture Organization of the United Nations. The Forest Products Annual Market Review 2020-2021. https://unece.org/sites/default/files/2021-11/2114516E_Inside_Final_web.pdf
- Muszynski et al. (2020). Global CLT industry in 2020: Growth beyond the Alpine Region. Proceedings of the 63rd International Convention of Society of Wood Science and Technology.
- FNR (2021). Absatzvolumen von Dämmstoffen in Deutschland 2019. https://mediathek.fnr.de/grafiken/daten-und-fakten/biobasierte-produkte/holzprodukte-und-baustoffe/absatzvolumen-von-dammstoffen-in-deutschland-2019.html. For example with innovative technologies to make it possible to use Beechwood fibre for insulation. See the press release about a recent project available at: https://news.fnr.de/fnr-pressemitteilung/neue-mahlscheiben-zur-herstellung-von-holzfasern-fuer-daemmstoffe. Accessed Feb, 2023.
- DIE PAPIERINDUSTRIE (2022). Statistiken zum Leistungbericht Papier. Available online: https://www.papierindustrie.de/papierindustrie/statistik/papier-2022-herunterladen
- Data is from NABU/sichtagitation, 2022 based on multiple sources (Die Papierindustrie e.V., Bundestagsdrucksache 19/12732) in the online article: Papierverbrauch in Deutschland: Weniger Schreibpapier und mehr Verpackungen. Available online: https://www.nabu.de/umwelt-und-ressourcen/ressourcenschonung/papier/30377.html. Accessed 9 March, 2023.
- UBA (2022). Altpapier. Online article. Available online: https://www.umweltbundesamt.de/daten/ressourcen-abfall/verwertung-entsorgung-ausgewaehlter-abfallarten/altpapier#vom-papier-zum-altpapier. Accessed 9 March, 2023.
- UBA (2022). Branchenabhängiger Energieverbrauch des verarbeitenden Gewerbes. Available online: https://www.umweltbundesamt.de/daten/umwelt-wirtschaft/industrie/branchenabhaengiger-energieverbrauch-des#der-energiebedarf-deutschlands. Accessed 10 March, 2023.
- FAO. Global production and trade in forest products in 2020. Available online: https://www.fao.org/forestry/statistics/80938/en/. Accessed 10 March, 2023.
- Ewijk et al. (2021). Limited climate benefits of global recycling of pulp and paper. Nat. Sust. doi: 10.1038/s41893-020-00624-z.
- EPN (2018). The state of the global paper industry: Shifting Seas: New challenges and Opportunities for Forests, People and the Climate. Available online: https://environmentalpaper.org/stateoftheindustry2018/
- GVM (2022). Potenzial der Materialeinsparung bei PPK-Transport- verpackungen durch den Einsatz von Mehrwegverpackungen. Im Auftrag von NABU. Available online: https://www.nabu.de/umwelt-und-ressourcen/ressourcenschonung/einzelhandel-und-umwelt/32308.html. Accessed 10 March, 2023.
- Read more online on the FNR website: https://pflanzen.fnr.de/industriepflanzen/arzneipflanzen/. Accessed Feb, 2023.
- FNR (2020). Biobased products facts and figures 2021. 4th Edition. Available online: https://www.fnr.de/fileadmin/Projekte/2020/Mediathek/Basisdaten-biobasierte_Produkte_2020_en_Web.pdf
- Textile Exchange (2022). Preferred Fiber and Materials Market Report. Available online: https://textileexchange.org/app/uploads/2022/10/Textile-Exchange_PFMR_2022.pdf. Accessed 9 March, 2023.
- Gschwandtner (2022). Outlook on global fiber demand and supply 2030. Lenzinger Berichte 97: 11-19.
- Pal et al. (2021). Physical Climate Risk for Global Cotton Production. Global Analysis. Cotton 2040 Forum for the Future and Willis Towers Watson.
- Over 60% of global apparent consumption of dissolving pulp occurs in China, which is a major player in the wood-based textile fiber market, e.g. through conversions of pulp mills. See: Kallio (2021). Wood-based textile fibre market as part of the global forest-based bioeconomy. Forest Policy and Economics, doi: 10.1016/j.forpol.2020.102364.
- Trace (2022). Understanding soy deforestation risk in leather products. Available at: https://cdn.sanity.io/files/n2jhvipv/production/37d0102a2331b1d06c502e9bb772c812a5664d98.pdf. Accessed 9 March, 2023.
- Mammadova et al. (2022). Deforestation as a Systemic Risk: The Case of Brazilian Bovine Leather. Forests 13, doi: 10.3390/f13020233.
- For more examples see the brochure from FNR „Holz Kann das” (available online at: https://www.charta-fuer-holz.de/fileadmin/charta-fuer-holz/dateien/service/mediathek/Flyer_HolzKannDas_240122.pdf)
- UN (2019). Forest Products Annual Market Review 2018-2019.
- Hassegawa et al. (2022). Innovative forest products in the circular bioeconomy. Open Res Europe 2:19, doi: 10.12688/openreseurope.14413.2.
- It was developed by the Fraunhofer Institute for Wood Research. See the project description online: https://www.wki.fraunhofer.de/en/departments/hnt/profile/research-projects/wood-foam.html. Accessed 9 March, 2023.
- FAO (2022). Global forest sector outlook 2050: Assessing future demand and sources of timber for a sustainable economy – Background paper for The State of the World’s Forests 2022. FAO Forestry Working Paper 31. Rome. doi: 10.4060/cc2265en.